tLarge cap US firms have substantial exposure to foreign markets In fact, because many US multinationals derive a high proportion of their reviews from overseas markets some investors try to gain exposure to foreign markets by simply owning US stocks.
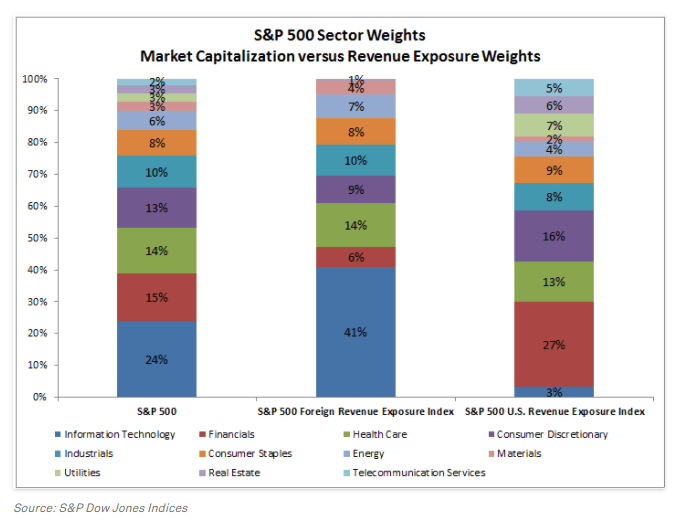
I have never seen a chart showing the US revenue of S&P 500 firms against their foreign revenues. But this week I came across a chart showing this comparison by sector sector .
Click to enlarge
Source:Capturing Global Market Gains Using U.S. Sectors, Indexology Blog
Of all the sectors in the S&P 500, The tech sector generates the most revenues from foreign markets. The sector accounts for only 24% of the index but earns 41% from overseas. Financials on the other hand derive more than one fourth of their revenues from the domestic market.