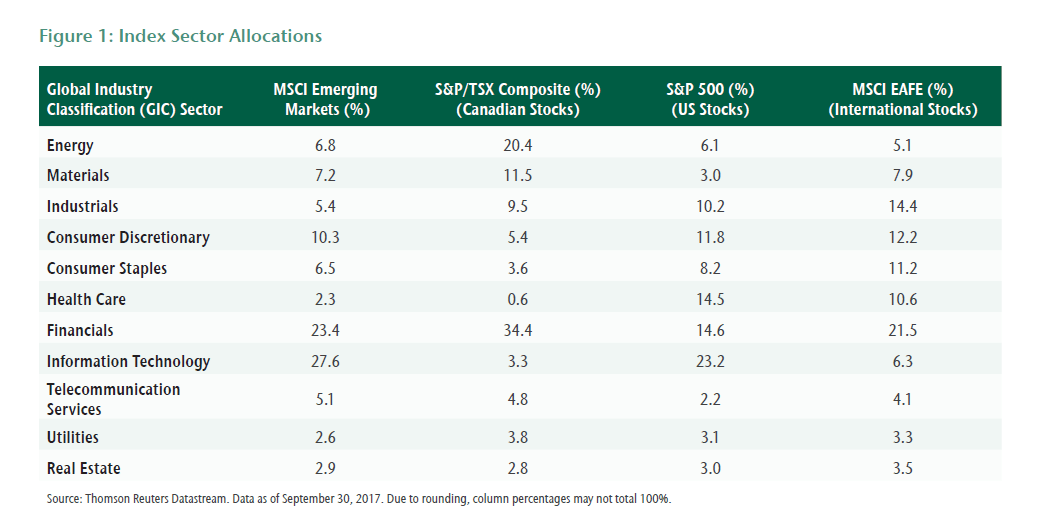
A neat infographic showing the current of the global economy:
Click to enlarge
Source: Schroders
China has the second largest economy in the world with a GDP of over $11.4 Trillion. The country is also one of the largest trading partners in the world. The US is China’s largest trading partner and China exports more goods to the US than it imports.
Below are some fascinating facts about China from a recent by Justin Leverenz at Oppenheimer Funds:
A short excerpt from the piece:
China’s role as a trading partner puts it in a unique position. Indeed, it is the largest trading nation in the world, at $3.96 trillion in net trade activity in 2015. That year, 101 countries and regions had more trade with China than the United States, while 43 (mostly developed countries) had less. In 2014, China accounted for 48% of Taiwan’s exports, 34% of the Philippines’, 33% of South Korea’s, 49% of South Africa’s, 28% of Chile’s, and 24% of Malaysia’s.
Click to enlarge
Source: On the Ground in China: Observations from the Middle Kingdom by Justin Leverenz , Oppenheimer Funds
In addition, China is also a voracious consumer of many of the major commodities. For example, according to the author China consumes some 13% of Russia’s oil, 28% of Brazil’s iron ore, 33% of Indonesia’s thermal coal, and 40% of Chile/Peru’s copper. Chinese traders are also major importers of Cobalt from Congo which is used in batteries for electric vehicles according to an article in WSJ this week.
The Russian equity market is highly correlated to the price of crude oil. Since Russia is one of the largest oil producers and exporters in the world, Russian stocks perform well when oil prices are high. Conversely declining oil prices leads to lower equity prices.
The chart below shows the close relationship between Russian stock market and oil prices:
Click to enlarge
Source: Investing in Russia’s Resurgence, by Justin Leverenz , Oppenheimer Funds
From the above article:
Russia could very possibly be the best performing market in the world this year. This is not an attempt at hyperbole, but rather a recognition that a convergence of variables, partnered with extremely attractive valuations, have set the stage for the market to shine.
But it has been a long and difficult road to get to this stage. The Russian market is closely linked to the oil price (see chart), so the collapse of oil from $140+ to below $40 in 2008 marked the start of almost a decade of disappointment. In that period, Russia’s influence in the emerging market (EM) world waned. At the end of 2007, its index weighting was 10.1%, fourth highest after China, South Korea and Brazil, with a market capitalization of $1.2 trillion. Today its weighting is just 3.3%. And its capitalization is less than half of what it was 10 years ago! Since mid-2017, oil has enjoyed a renaissance, currently flirting with $70 levels, with increasing confidence that $60+ is sustainable. The ruble – which is intricately linked to crude oil prices – has stabilized, having fallen 40% since oil stumbled violently in October 2014.
The entire above-linked article is worth a read.
Pullbacks are normal in equity markets. Over the long-term stocks tend to always climb a wall of worry and yield positive returns. So short-term corrections should not surprise long-term investors. Generally stocks go up when considered over many years. To put it another way, though corrections occur every now and then, stocks yield positive returns over the long-term measured in years and decades. The following example of the performance of Australian stocks since the 1900:
Click to enlarge
Source:The pullback in shares – seven reasons not to be too concerned by Shane Oliver, AMP Capital, Feb 9, 2018
From the recent GFC to tech bust of the late 1990s Aussie stocks have recovered ground each time and have continued to go higher.
Pullbacks are common in equity markets. In any given years stocks tend to go up and down for any number of random reasons. Just because stocks have had declines in a year does not mean they will have a negative return for that year. Even when stocks have had big declines they have soared back to yield positive returns for the year.
From a recent article at Charles Schwab:
It isn’t unusual to see pullbacks. The peak-to-trough drawdown in global stocks so far this year, at about 8%, is only about half of the average annual pullback of the past 37 years. That could mean there is more to come, either for the current pullback or additional pullbacks over the course of the year. Global stocks have fallen from peak-to-trough by more than 10% in two-thirds of the years since 1979; yet most of those times still posted a gain for the year, as you can see in the chart below.
Declines are common and usually don’t mean losses for the year

Past performance is no guarantee of future results.
Source: Charles Schwab, Factset data as of 2/7/2018.
Source: Schwab Market Perspective: Volatility…it’s Back!, Schwab