The Finnish Center for Pensions has updated their global retirement age chart for 2022. As in the previous version, the average retirement age in the EU is 65 but is set to increase in 67 in some countries due to higher life expectancy and other factors. Countries such as the Canada, Finland, Norway, Sweden and the US have flexible retirement ages. For these countries the indicated retirement age is the lower age limit.
The chart below shows the current retirement ages (2022) and future retirement ages in select countries:
Click to enlarge
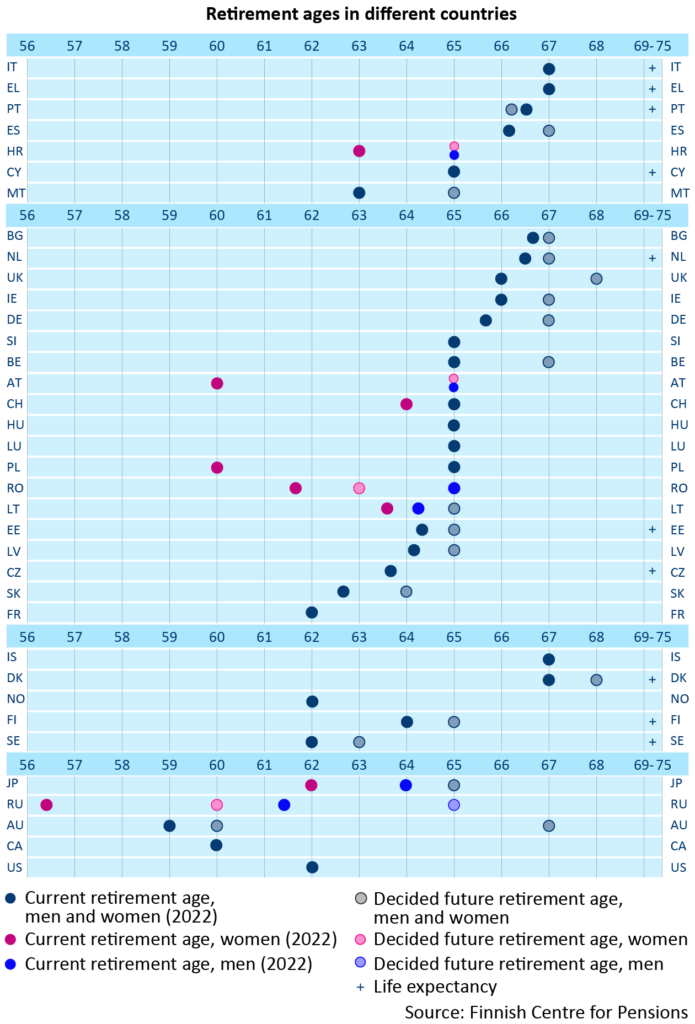
Source: Retirement Ages, The Finnish Center for Pensions
Earlier: