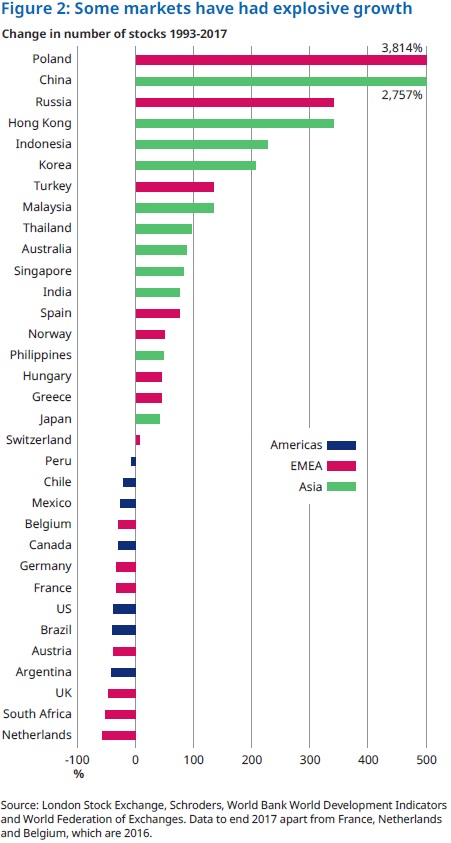
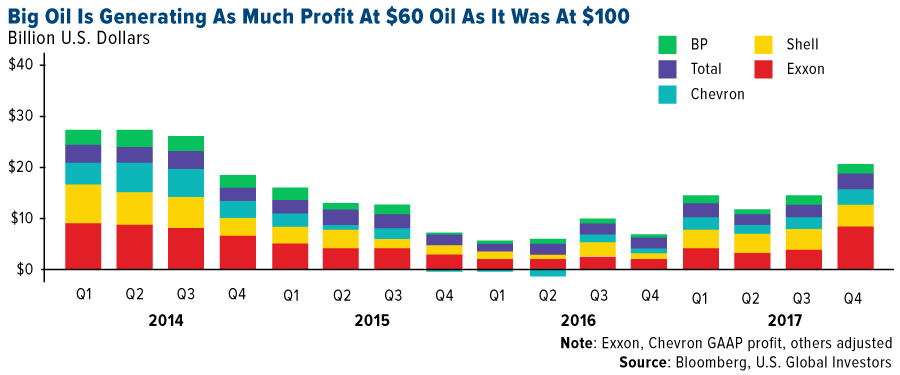
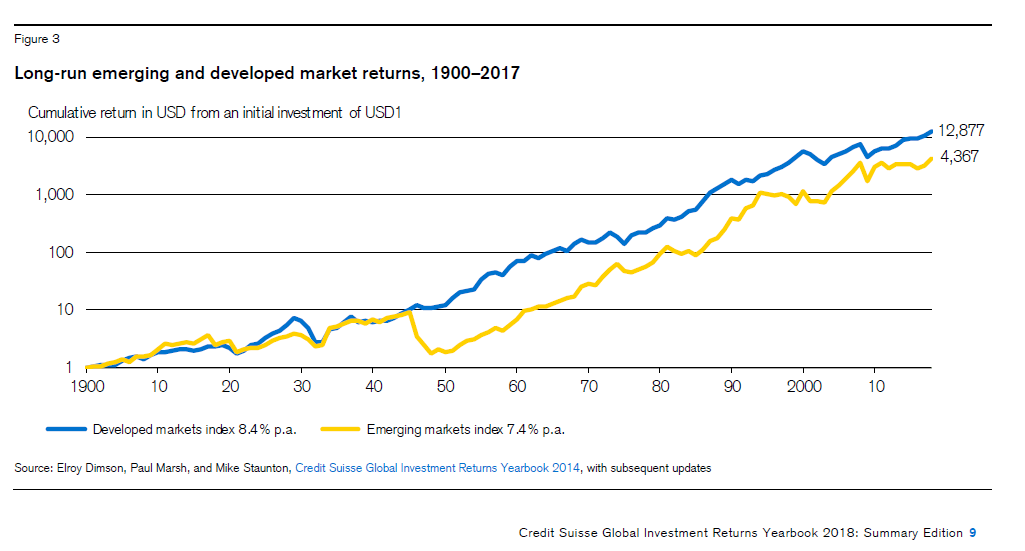
Should Investors Really Worry About The Decline in the Number of Public Companies?

The number of public companies in the US has continued to decline for many years now. One of the implications of this scenario is that investors have fewer options to invest in. To put it another way, billions of dollars flowing into the equity markets have fewer places to find a home. As a result, one theory goes that some stocks continue to soar and remain elevated despite the lack of fundamentals. High-flying tech stocks for example have shot up higher in recent years as investors are attracted to their growth potential and there are only a limited of these companies that are publicly traded.

The following is an excerpt from a journal story late last year on the decline in US public companies:

The media and the public pay a lot of attention to broad stock market indexes, but many of the most well-known measures aren’t what they seem. The Wilshire 5000, for example, contains roughly 3,500 companies. There haven’t been 5,000 domestic stocks to include in the index since 2005.

The number of public companies in the U.S. has been on a steady decline since peaking in the late 1990s. In 1996 there were 7,322 domestic companies listed on U.S. stock exchanges. Today there are only 3,671. Easy access to venture, growth and private-equity capital means that companies no longer need to pursue an initial public offering to fund growth or access liquidity. Increases in regulations, shareholder lawsuits and activist demands have also diminished the appeal of a public listing. Over the past two decades, the number of annual IPOs has fallen sharply, to 128 in 2016 from 845 in 1996. (emphasis mine)

Source: Where Have All the Public Companies Gone?, WSJ, Nov 16, 2017

However according to an article by Jim Rowley at Vanguard, the decline in the number of public companies is mostly in the micro-cap stocks and investors need not worry about the negative implications of reduced options.From the article at Vanguard Blog:

Picture 1 shows that the falling number of public companies is largely attributable to a drop-off in the number of micro-cap companies.

Picture 1

Notes: Large, mid, low, and micro are defined by CRSP. The first and second deciles are defined as large-cap; the third, fourth, and fifth are defined as mid-cap; the sixth, seventh, and eighth are defined as low-cap (i.e., small-cap); and the ninth and tenth are defined as micro-cap. Only securities that had portfolio assignments at year-end were used.

Source: Vanguard calculations, based on data from CRSP.

Picture 2, however, shows that micro-caps’ proportion of overall market capitalization has stayed relatively stable, at around 1.5%.

Picture 2

Notes: Large, mid, low, and micro are defined by CRSP. The first and second deciles are defined as large-cap; the third, fourth, and fifth are defined as mid-cap; the sixth, seventh, and eighth are defined as low-cap (i.e., small-cap); and the ninth and tenth are defined as micro-cap. Only securities that had portfolio assignments at year-end were used.

Source: Vanguard calculations, based on data from CRSP.

It is critical to highlight this because these smallest firms are not considered investable for most mutual funds and are not included in many indexes because of their illiquidity.

Therefore, the shrinking number of publicly listed companies consists almost entirely of those securities that would not have been invested in by active and passive funds anyway. Despite the drop in the number of publicly listed companies, the implications for investors appear to be few, if any.

Source: Two pictures are worth 2,000 words by Jim Rowley , The Vanguard Blog for Advisors

Jim’s argument supported by the above data is indeed convincing. But in general the number of companies going public has decreased and many of the large successful startup firms continue to remain private and out of the reach of the general investing public. Moreover a handful of highly popular stocks such as the FAANG stocks have become large enough to dominate entire sectors and drive the overall market. So though the number of large caps that are public remain fairly stable over the years just a few firms dominating the market is not the ideal situation for a free market economy.


Gold vs. S&P 500 Since 1999: Chart

Gold has outperformed the S&P 500 Index and S&P 500 Total Return Index since 1999 by a substantial margin. According to a post by By Frank Holmes of U.S. Global Investors, stocks have lagged gold even when considering returns with dividends reinvested.

Click to enlarge

Source: Could the Stars Be Aligned for $1,500 Gold?, U.S. Global Investors

Related Posts:

Related ETF:

  • SPDR Gold Shares Trust (GLD)

Disclosure: No Positions

The World’s Top Long-Haul Flights: Chart

Australian airline Qantas began non-stop flights between London,UK and Perth Australia today.The flight will cover a distance of 14,498 kms (or 9,000-miles) in 17 hours. The below neat chart from Bloomberg shows some of the world’s top existing and proposed long-haul flights:

Click to enlarge

Source: Qantas Passes Aviation Milestone With Direct Perth-London Flight, Bloomberg

Sitting for 17 hours in a plane sounds fun….

You may also read:  The evolution of UK-Australia travel into a single flight, The BBC

Consolidation Among U.S. Commercial Banks

Consolidation in the U.S. commercial banking sector has led to a substantial declines in the number of banks available for banking. According to the Federal Reserve Federal Reserve Bank of St. Louis Economic Research report titled “Commercial Banks in the US.” the number of banks has fallen to 4,900 current. That is a decline of 66% from 1984.

Shawn Lyons, CFA of Franklin Templeton Investments posted an interesting article yesterday on the US banking industry. From the article:

We live in a digital world. Customers have a lot of alternatives to traditional banking. In the United States, there are nearly 5,000 banks.That’s a far cry from the 14,000 or so we had in 1984, and the 7,000 or so we had pre-GFC. But what that does tell us is that we’ve had robust merger-and-acquisition (M&A) activity in the banking industry for quite some time.

M&A does present challenges from a technology standpoint. When you merge two old institutions, the legacy technology usually gets a band-aid to make a square peg fit into a round hole so to speak. You can merge two banks and slap new signage on the buildings, but it’s what’s behind the storefront that is key.

By and large, US banks haven’t traditionally been innovators. Many have technology that is still in the mainframe era, not in the cloud era. So, a lot of these new financial technology (fintech) companies have an advantage in that they can be in real time—their systems can immediately talk to each other. Traditional banks are spending an enormous amount on technology as this area is both a challenge and tremendous  opportunity.

Banks have also faced a regulatory burden. However, the trajectory of that burden seems to be reversing (or at least stabilizing) under the new US administration. Banks should now have more money freed up to spend on technology, including competitive types of payment platforms. There are a number of things banks are trying to do with cloud-based technology and transacting in real time. I think fintech is pushing and pulling traditional banks to innovate and to compete.

Source: Banking Sector Under the Microscope,  Franklin Templeton Investments, March 20, 2018

The entire piece is worth a read.