Revenue Exposure Of Australia S&P/ASX 200 Index

The S&P/ASX 200 is one of the main benchmark index of the Australian equity market. The index is comprised of 200 largest firms by float-adjusted market capitalization.

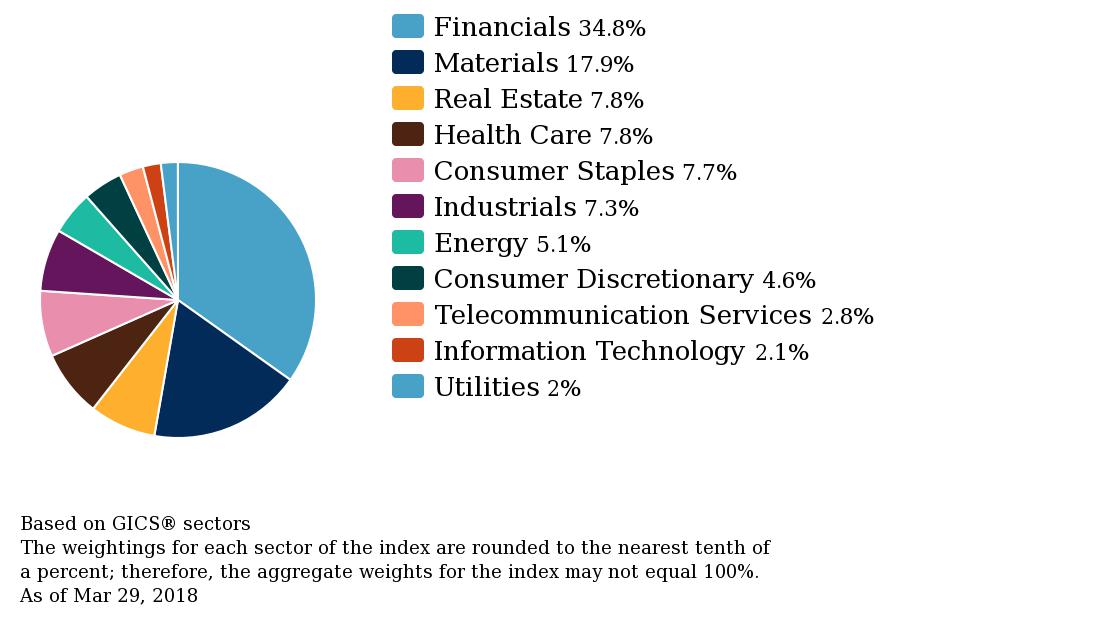
From a sector allocation perspective, over half of the index is made up of financials and materials as shown in the chart below:

Click to enlarge

Source: S&P Indices

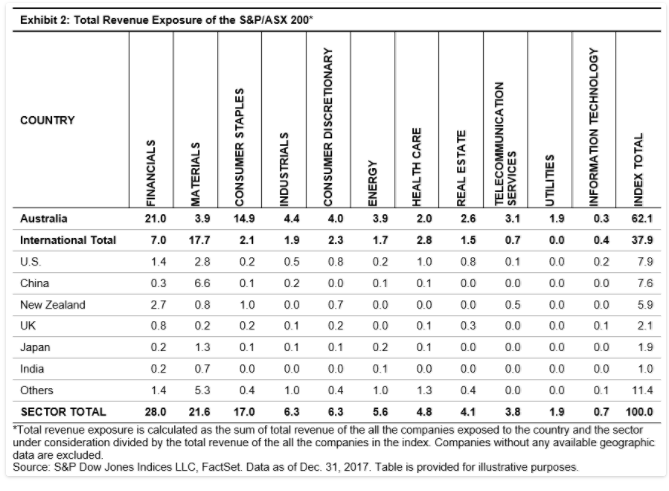
The following table shows the revenue exposure breakdown of the S&P/ASX 200 companies:

Click to enlarge

Source: Revenue Exposure of the S&P/ASX 200 by Utkarsh Agrawal, Indexology Blog

A few observations:

  • About 40% of the index’s revenue come from foreign markets.
  • The highest revenue exposure is to the US, China and New Zealand.
  • Not surprisingly the material sector has the most exposure to foreign countries (18%). For example, most of the coal and iron ore mined in the country are exported to China and other countries.

The key takeaway for investors in Australian stocks is that economic conditions of foreign countries will have an impact of the performance of Australian firms. This is especially true with companies in the material sector where a booming demand for commodities overseas will determine the earnings of Aussie mining firms than the economy of the domestic market.

Related ETF:

  • iShares MSCI Australia Index Fund (EWA)

Disclosure: No Positions

Also seeThe Components of the S&P/ASX 200 Index

55 Leading Mining and Oil Stocks in Australia

Australia is a commodity-based economy similar to Canada. Some of the major exports of Australia are coal, iron ore, agricultural products such as wheat and wool and natural gas. Accordingly the Australian equity market is dominated by mining and oil companies in addition to financials. Other than financials, investors looking for Aussie exposure may have to consider some of the miners and resource firms.

The following list of 55 leading Australian mining and oil stocks can be used as a starting point for further researching opportunities in those sectors:

S.No.Company Name
1Altura Min
2Alumina
3Ausdrill
4AWE
5Beach Energy
6BHP
7BlueScope Steel
8Caltex Aust
9Champion Iron
10Cooper Energy
11Dacian Gold
12Evolution Min
13Fortescue Metals Grp
14Galaxy Res
15Global Geoscience
16Gold Road Res
17Iluka Res
18Independence Grp
19Kidman Res
20Lynas
21Macmahon
22Metals X
23Mineral Resources
24NEW Century Res
25New Hope Corp
26Newcrest Min
27Northern Star
28OceanaGold Corp
29Oil Search
30OM Hldgs
31Origin Energy
32Orocobre
33OZ Min
34Perseus Min
35Pilbara Min
36Regis Res
37Resolute Min
38Rio Tinto
39Sandfire Res
40Santos
41Saracen Min
42Senex Energy
43Sims Metal Mgmt
44WH Soul Pattinson
45South32
46St Barbara
47Syrah Res
48Western Areas
49Westgold Res
50Whitehaven Coal
51Woodside Pet
52WorleyParsons
53Yancoal Aust
54Z Energy
55Zimplats Hldgs

Source: AFR

Some of the above firms trade on the OTC markets in the US. The complete list of Australian ADRs is listed here.

Download:

Disclosure: No Positions

Equity Market Valuations: Which Markets Are Cheap Now?

US stocks continue to remain expensive relative to other markets according to a recent article posted at Schroders. Going into 2018, US equities were expensive based on multiple metrics. So even after the decline and volatility in the first quarter of this year, valuations are not in favor of American stocks.

Click to enlarge

Source: Which stockmarkets look cheap after the torrid start to 2018?, by Duncan Lamont, Schroders

From a overall valuation perspective emerging markets are relatively attractive than developed markets.

Related ETFs:

  • iShares MSCI Emerging Markets ETF (EEM)
  • Vanguard MSCI Emerging Markets ETF (VWO)

Disclosure: No Positions

Auto Penetration Rate in China, India vs. Developed Countries: Chart

One of the main luxuries of emerging middle class in developing countries is the ownership of an automobile. Auto penetration rate is very low in emerging countries of China and India relative to the developed world as shown in the chart below:

Click to enlarge

Source: CPD: All aboard the new Silk Road, Adviser Voice

The US has the highest auto penetration rate in the developed world since public transportation is virtually non-existent in most parts of the country. Relative to the US and other developed countries India has the lowest auto penetration rates. Though China is ahead of India in terms of economic development, the auto penetration rate in China is still far below than the rate in developed countries. While China will never have cars as the primary means of transport for majority of the people, opportunity exists for car ownership rates to go higher as rising incomes will lead to higher car sales.