The Top 10 Gold Producing Countries 2017

The Top 10 Gold Producing Countries based on 2017 data is shown in the chart below. Surprisingly  China was the top producer last year beating Australia and South Africa. Many investors myself included may not know that China mines gold let alone being the largest gold producer in the world.

Click to enlarge

Source: Top 10 Gold Producing Countries, U.S. Global Investors

Related ETF:

  • SPDR® Gold Shares Trust (GLD)

Disclosure: No Positions
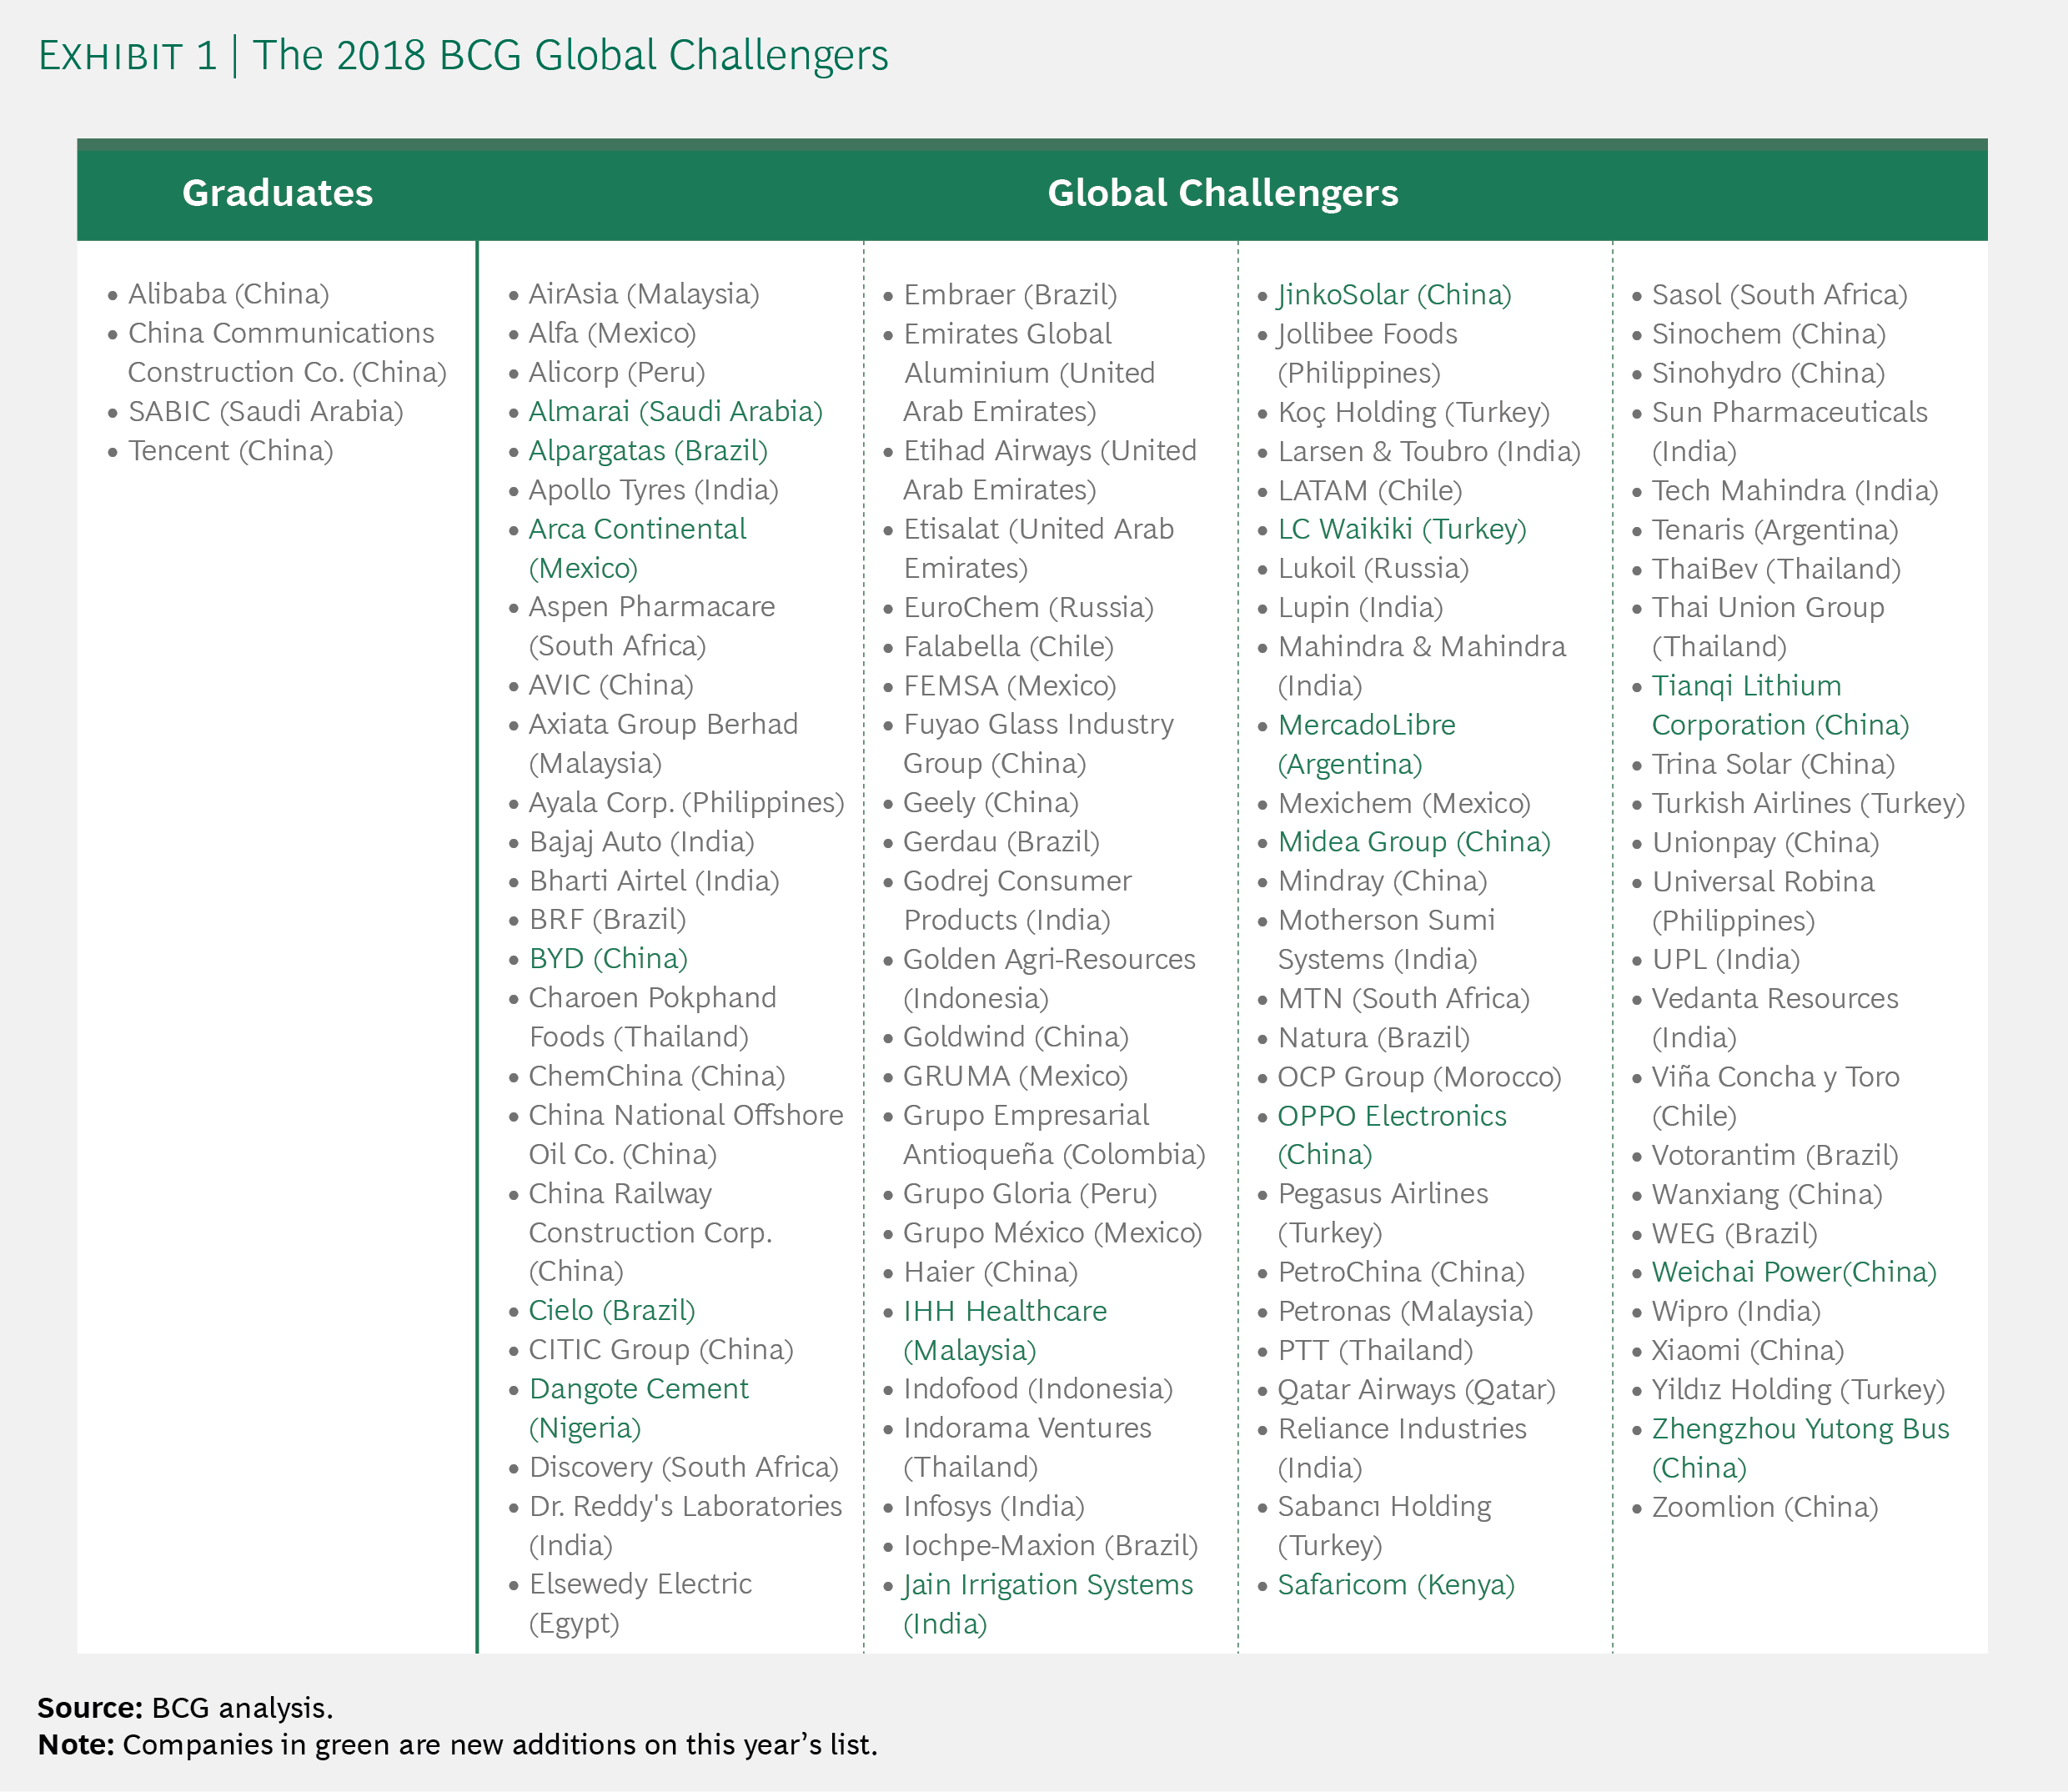
The 2018 BCG Global Challengers

The 2018 Global Challengers list of companies from 2018 BCG Global Challengers: Digital Leapfrogs report.

Click to enlarge

Source: Meet the 2018 Global Challengers, Boston Consulting Group

Some of the notable firms in the above list are Mercadolibre Inc(MELI) of Argentina,Fomento Economico Mexicano SAB (FMX) aka FEMSA of Mexico, Vina Concha y Toro SA (VCO) of Chile, PetroChina (PTR) of China, etc.

Disclosure: No Positions

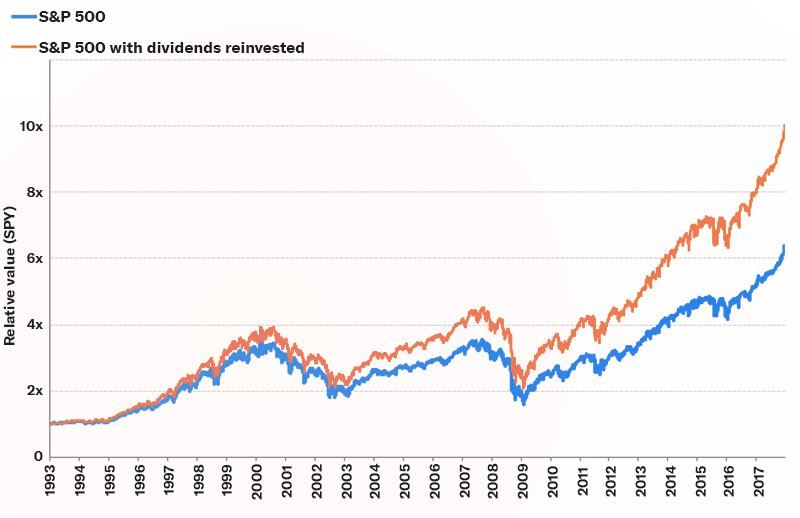
S&P500 Returns vs. S&P 500 With Dividends Reinvested Returns: Chart

The returns of the S&P 500 Index often published by the media and others is the price return. However for investors the correct return that matters for the index is the returns including dividends reinvested. This is because S&P 500 firms pay dividends and most long-term investors reinvest them. Currently the dividend yield on the S&P 500 is 1.80%.

The difference in returns between returns not including dividends and returns with dividends reinvested is significant as shown in the following chart:

Click to enlarge

Source: HOW’D THE MARKET DO? THAT’S HARDER TO ANSWER THAN YOU THINK by Morgan Housel, Betterment

The Compound Average Annual Return from 1993 to 2017 for S&P 500 is 7.7%. When dividends reinvestments are included the figure jumps to 9.7% according to Morgan Housel.

He also calculates the real return for an investors which takes into account inflation and taxes. Based on this measure the S&P 500 with dividends reinvested declines to just 6.8% for the period noted.

Related ETFs:

  • SPDR S&P 500 ETF (SPY)

Disclosure: No Positions

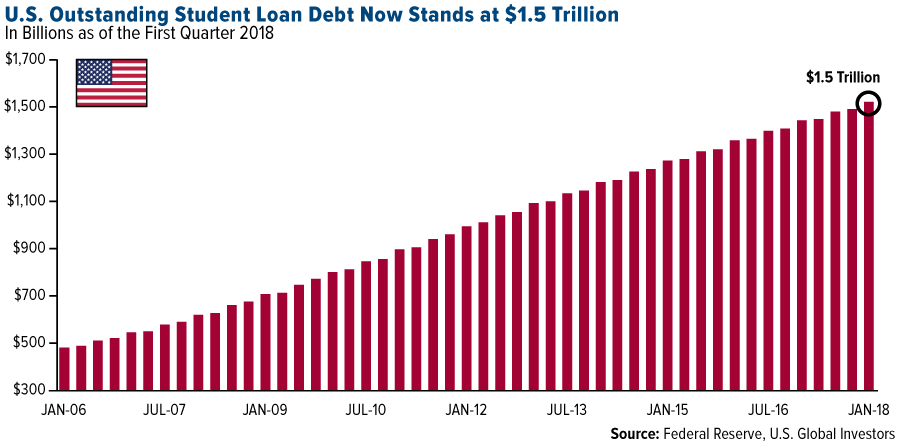
U.S. Outstanding Student Loan Debt Mountain Reached $1.5 Trillion

Student loan debt is the largest debt in the US after mortgages. According to the Federal Reserve, the outstanding US student loan debt reached an astonishing $1.5 Trillion at the end of first quarter, 2018. This debt mountain is so huge that it is bigger than even outstanding credit card loans and auto loans.

From an investment impact perspective, investors need not fear a student loan debt crisis. This is because unlike mortgages most of the student loans is held by Uncle Sam and there are always ways the state can help students if they fail to replay. Outright cancellations of debt, debt forgiveness for students working in the civil service, postponement of debt repayments, etc. are some of the options. So though $1.5 Trillions for most investors it simply means nothing.

Click to enlarge

Source: Texas Gold Investors Just Got Their Own Fort Knox by Frank Holmes, U.S. Global Investors

Earlier: