The returns of the S&P 500 Index often published by the media and others is the price return. However for investors the correct return that matters for the index is the returns including dividends reinvested. This is because S&P 500 firms pay dividends and most long-term investors reinvest them. Currently the dividend yield on the S&P 500 is 1.80%.
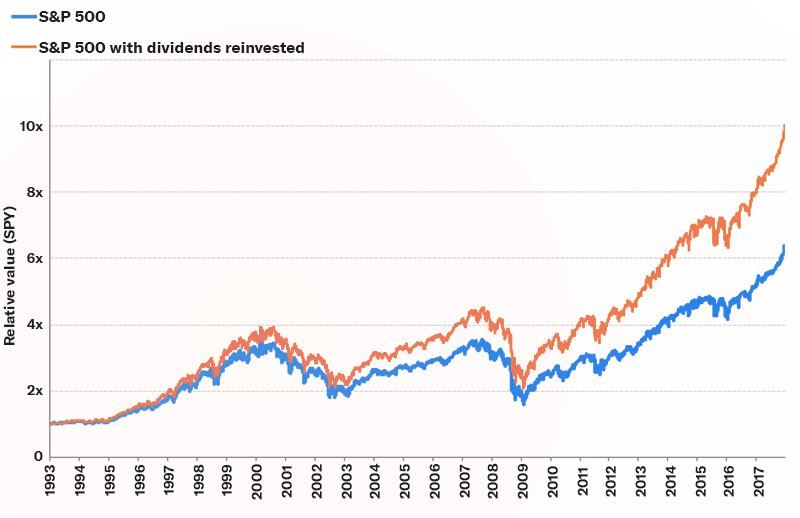
The difference in returns between returns not including dividends and returns with dividends reinvested is significant as shown in the following chart:
Click to enlarge
Source: HOW’D THE MARKET DO? THAT’S HARDER TO ANSWER THAN YOU THINK by Morgan Housel, Betterment
The Compound Average Annual Return from 1993 to 2017 for S&P 500 is 7.7%. When dividends reinvestments are included the figure jumps to 9.7% according to Morgan Housel.
He also calculates the real return for an investors which takes into account inflation and taxes. Based on this measure the S&P 500 with dividends reinvested declines to just 6.8% for the period noted.
Related ETFs:
- SPDR S&P 500 ETF (SPY)
Disclosure: No Positions
