The Top 10 Pharmaceutical Companies 2018

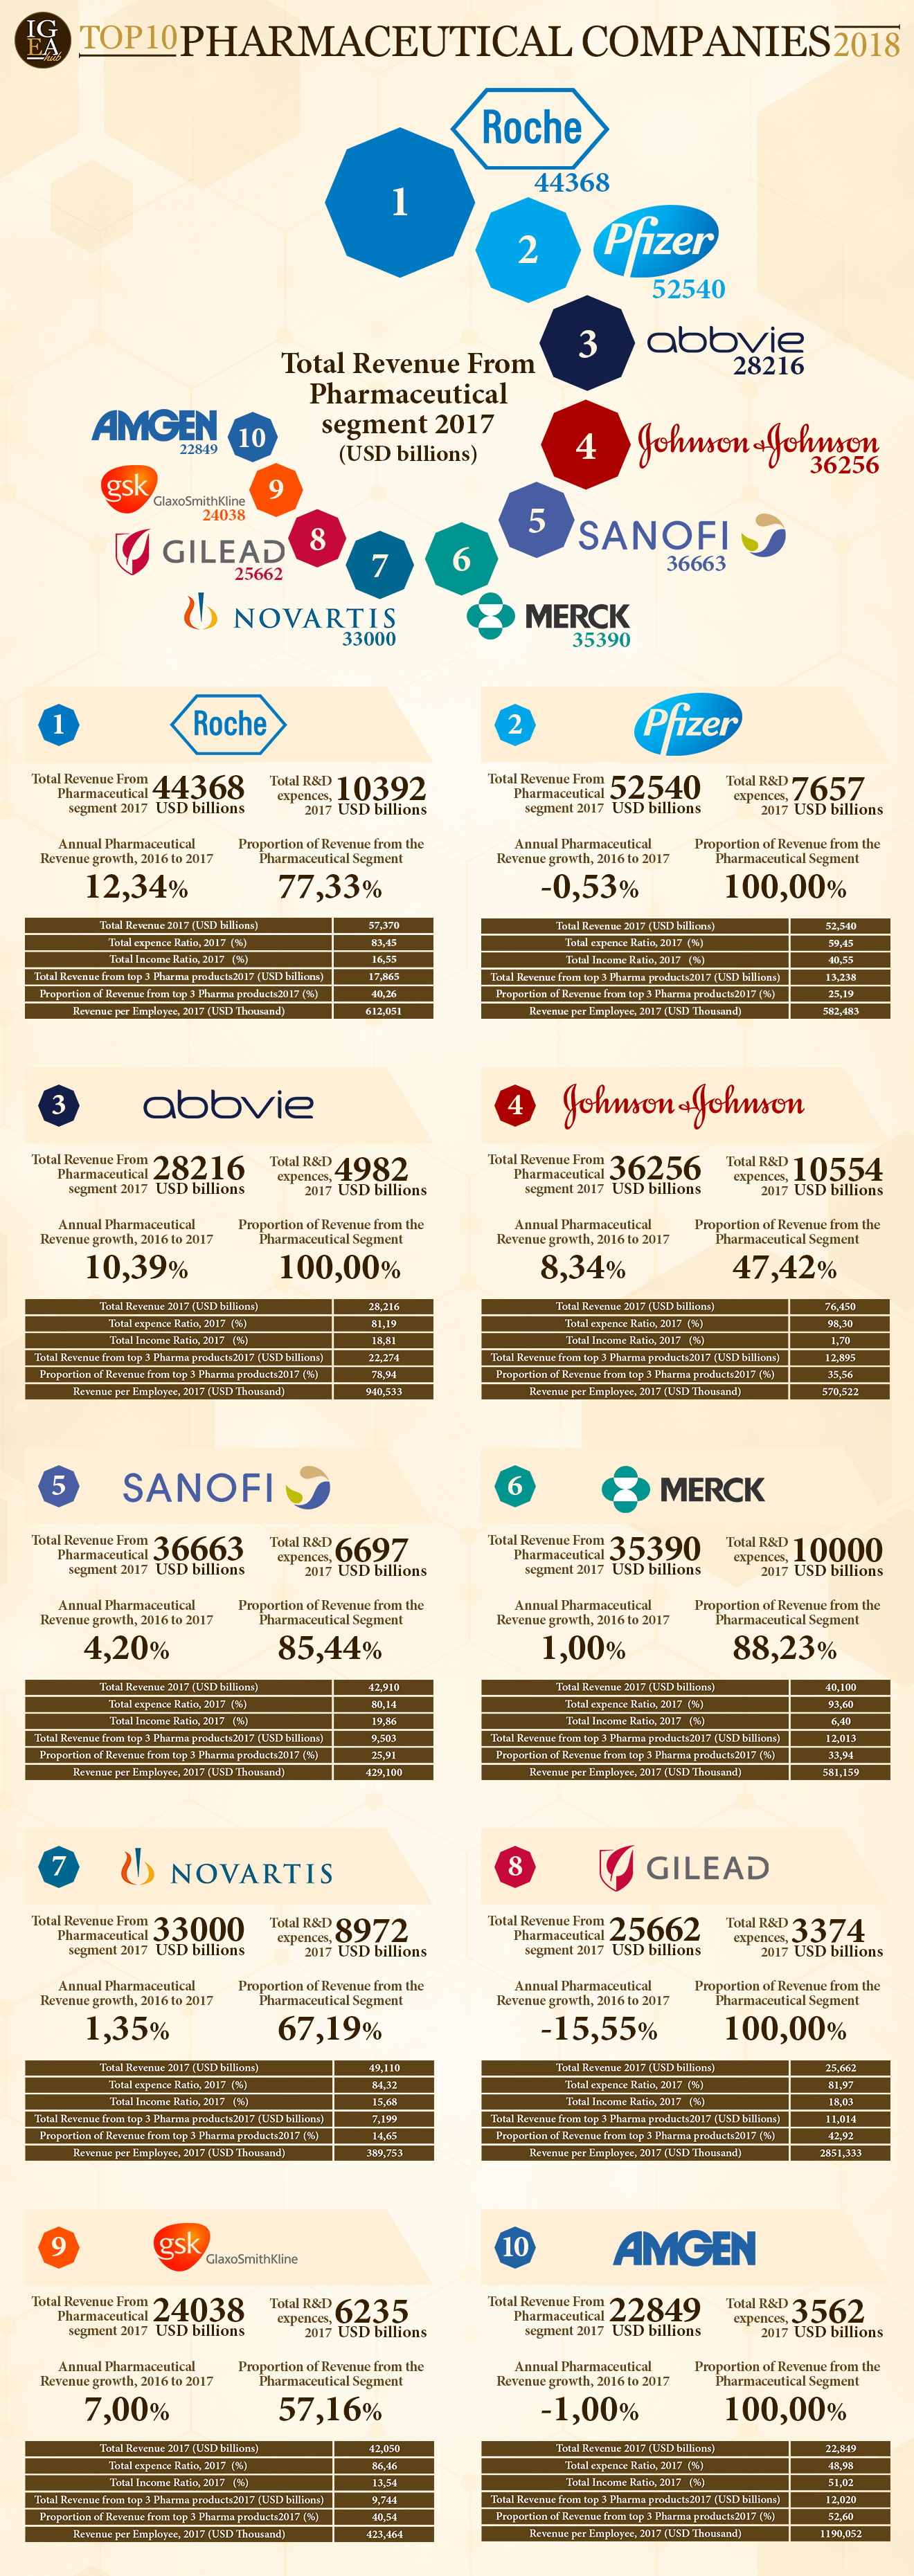
The global pharmaceutical industry is huge and was estimated to be over $1.11 Trillion in 2017. The Top 10 firms alone generated revenues of over $437.0 billion accounting for about 40% of the global market share according to a report published earlier this year by IGEA Hub. They analyzed the top 15 companies to develop and identify the top ranked 10 companies. The criteria used in the ranking is described below:

The ranking model incorporated seven criteria for each organization with focus on revenues generated by pharmaceutical products and growth in pharmaceutical revenues (2016 – 2017). The criteria includes pharmaceutical revenues, annual pharmaceutical revenue growth, total R&D expense, total expense, total income, proportion of revenue from top three pharmaceutical products and revenue per employee. A score statistic was developed based on these selected criteria. Each company was assigned a score for each criteria and a weighted sum was used to arrive at the final score statistic. Pharmaceutical revenue received the highest weight (45%) while revenue from top 3 products (5%) receives the lowest. The score statistic represented the pharmaceutical financial health and diversity of product portfolio of each company.

The following infographic shows The Top 10 Pharmaceutical Companies 2018 based on revenues in 2017:

Click to enlarge
Source: IGEA Hub

The US market tickers of the above firms are listed below:

Europe-based: Roche Holding AG (RHHBY), Novartis AG (NVS), Sanofi (SNY), GlaxoSmithKline (GSK)

US-based: Pfizer Inc (PFE), AbbVie Inc(ABBV), Johnson & Johnson (JNJ), Merck & Co Inc (MRK), Gilead Sciences, Inc.(GILD), Amgen(AMGN)

Investors looking to add some exposure to the pharma sector can start their research beginning with these drug giants.

Disclosure: No Positions

Also checkout:
U.S vs. Canadian Financials: Which Is Better?

The U.S. financial sector is similar to the Canadian financial sector in some ways but different in others. For example, the banking industry in Canada is dominated by just 5 or 6 major banks forming a nice oligopoly. However it is not the case south of the Canadian border.

From the standpoint of equity returns, is the US financial sector better than the Canadian one or the other way around?

The answer to the above question is US financials are better in the short term but Canadian financials beat their US peers in the long run.

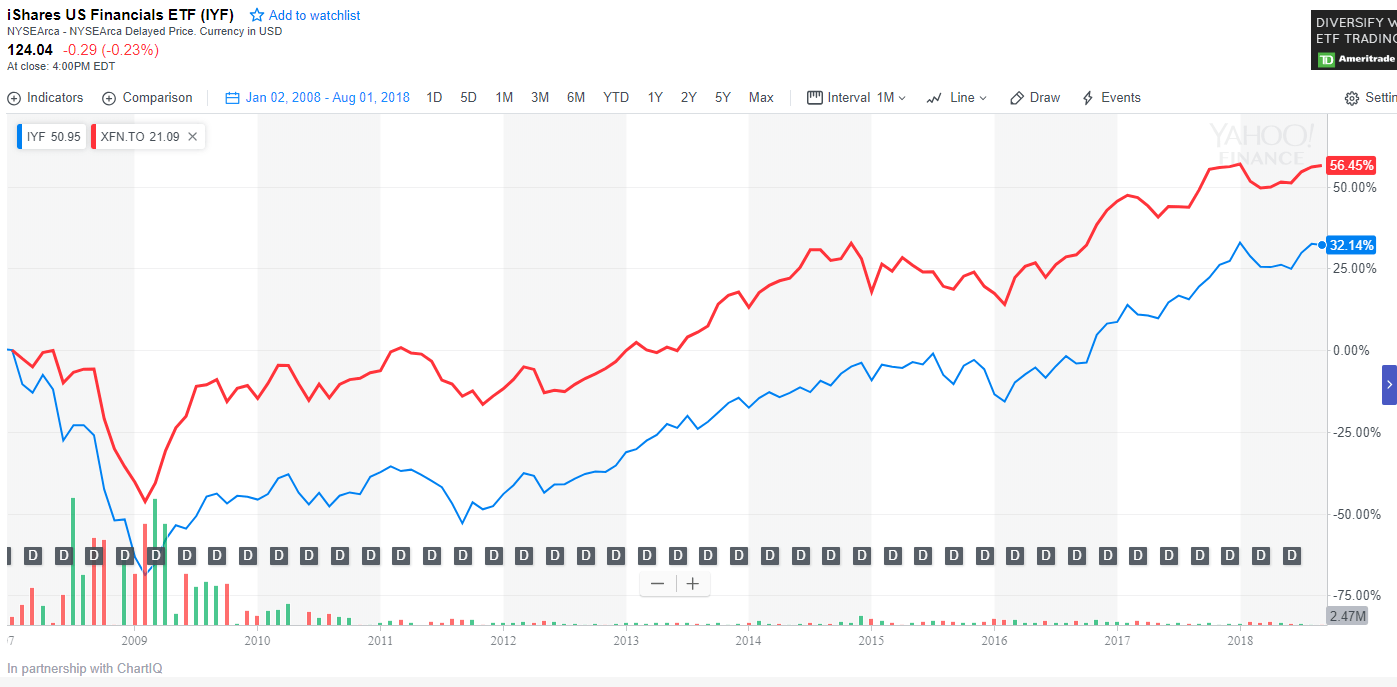
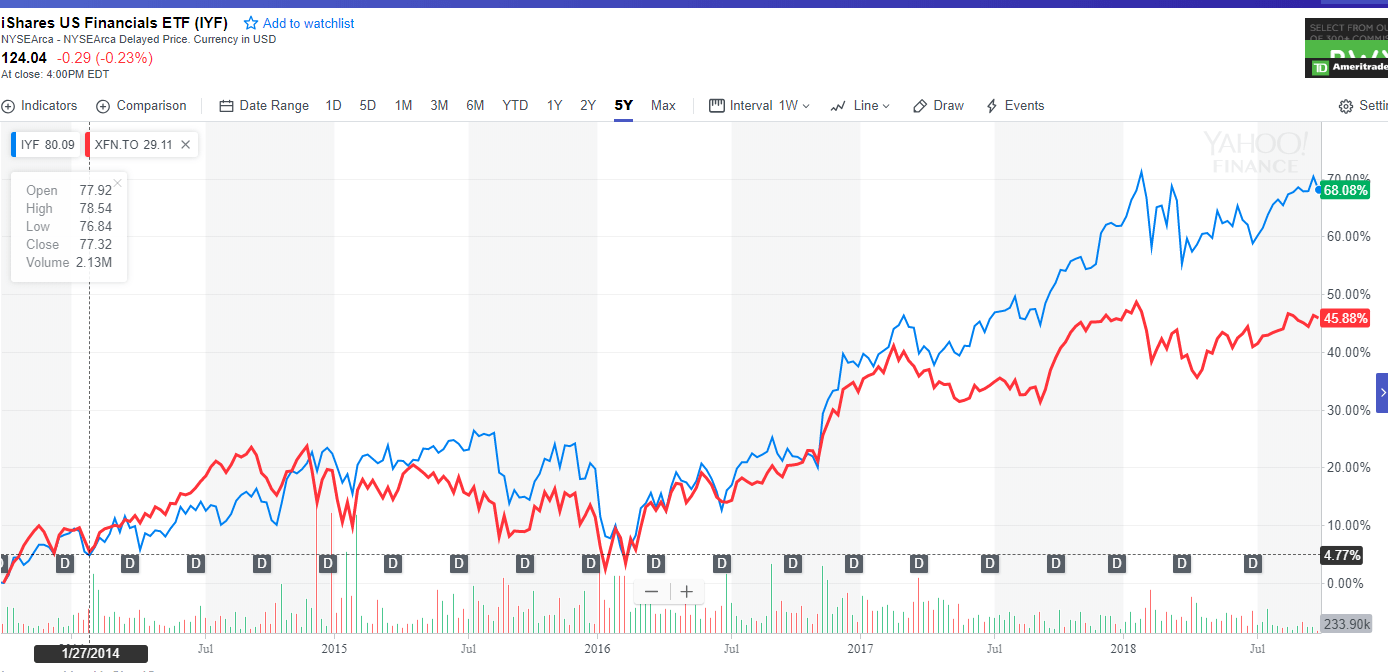
For instance, while US financials have performed very well in the recent past – say 5 years compared to their Canadian counterparts. Let us use the iShares S&P/TSX Capped Financials Index ETF(XFN.TO) trading on the TSX as a proxy for Canadian financials and the iShares U.S. Financials ETF (IYF) for the US. The big five Canadian banks account for about 65% of the ETF while five major banks constitute only about 23% of the US ETF.

Click to enlarge

Source: Yahoo Finance

Clearly the US financial sector has strongly outperformed the Canadian peer in the past 5 years.

However comparing returns from Jan 1, 2008 thru Sept 25, 2018 shows that Canadian financials yielded 24% more in return than their American counterparts.

Click to enlarge

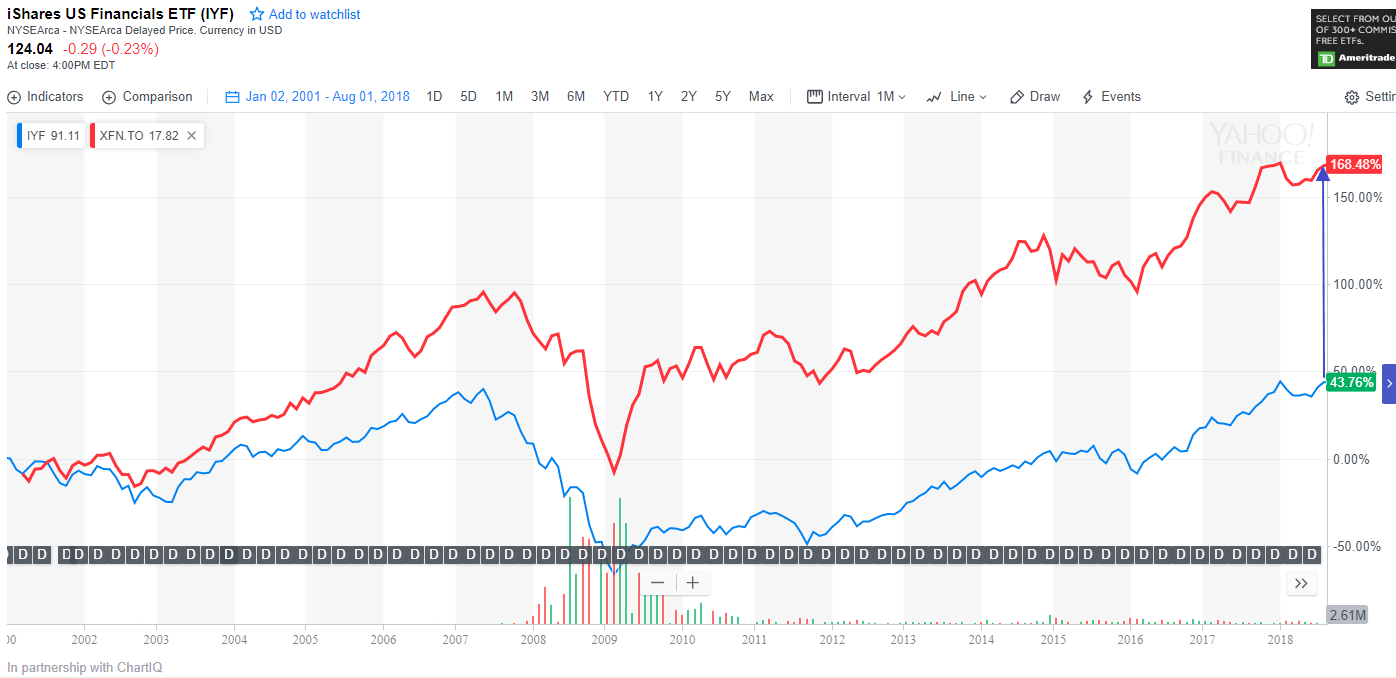
In terms of long-term returns from 2001, Canadian financials have vastly outperformed US financials as shown in the chart below. In fact, the gap between the two returns is huge.

Click to enlarge


Source: Yahoo Finance

In the recent past, the commodity-driven economy of Canada has been adversely affected by falling commodity prices particularly oil. Hence financials under-performed. But over long periods Canadian financials have earned much higher returns over their American peers.

Note: The above comparison does not include the impact of taxes and foreign exchange rate fluctuations.

Disclosure: No Positions

Related:

Five Global Currencies That Are Closely Tied To Commodities

Some of the major countries in the world are commodity based economies.Heavy dependence on commodity exports affects the relative value of their currencies. The five currencies that are closed tied to commodities are:

1.Australian Dollar – Australia is the world’s largest producer and exporter of iron ore. Demand for the ore strongly impacts the Australian dollar value.

2.Canadian Dollar – Crude oil is the largest export product in terms of revenues to the government. Rising oil prices positively impact the Canadian currency.

3.Russian Ruble – As one of the largest exporters of oil and natural gas, the prices of these commodities directly impact the Russian Ruble.

4.Colombia Peso – Oil is the major export product and the major contributor of revenue to the government.

5.Peruvian Sol – Peru is a major copper producing and exporting country. The country is the second largest exporter of Copper after Chile. Copper price movements have an impact on the Sol.

Source: 5 World Currencies That Are Closely Tied to Commodities, U.S. Funds

Interest Payments on National Debt: Chart

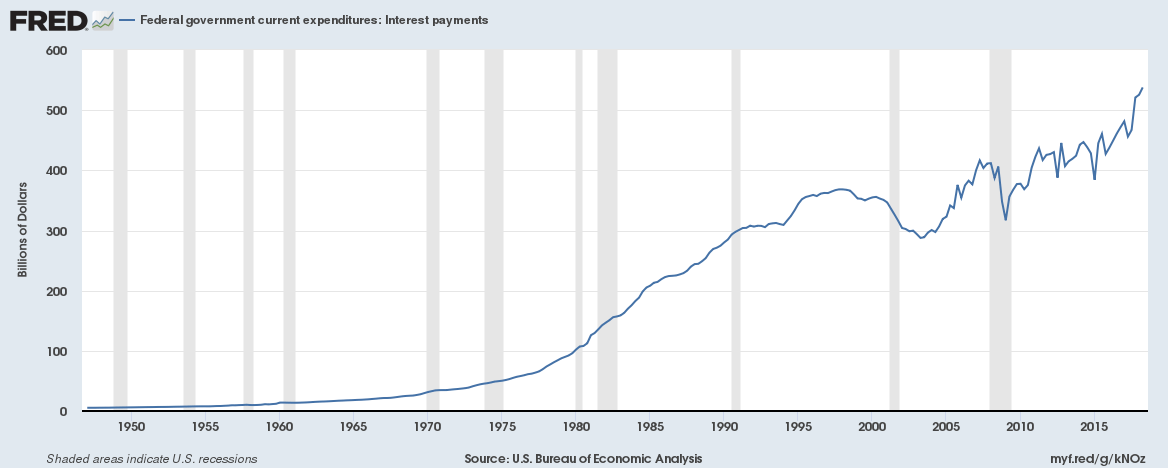
The current US National Debt is over $15.7 Trillion or 15,760,417,329,521.12 to be exact as of Sept 20, 2018 according to the US Treasury. The interest due on this huge mountain of debt is also huge. According to an article, the interest on this debt accounts for 7.4% of the US Federal Budget making it the fifth largest budget item. The only four expenses that are larger than the interest payments are Social Security benefits ($987 billion), military spending ($874.4 billion), Medicare ($582 billion), and Medicaid ($400 billion) according to a piece in The Balance.

As the accumulated debt continues to grow year after year so does the interest paid. The chart below shows the interest payments since 1950:

Click to enlarge

Source: FRED, St. Louis Fed

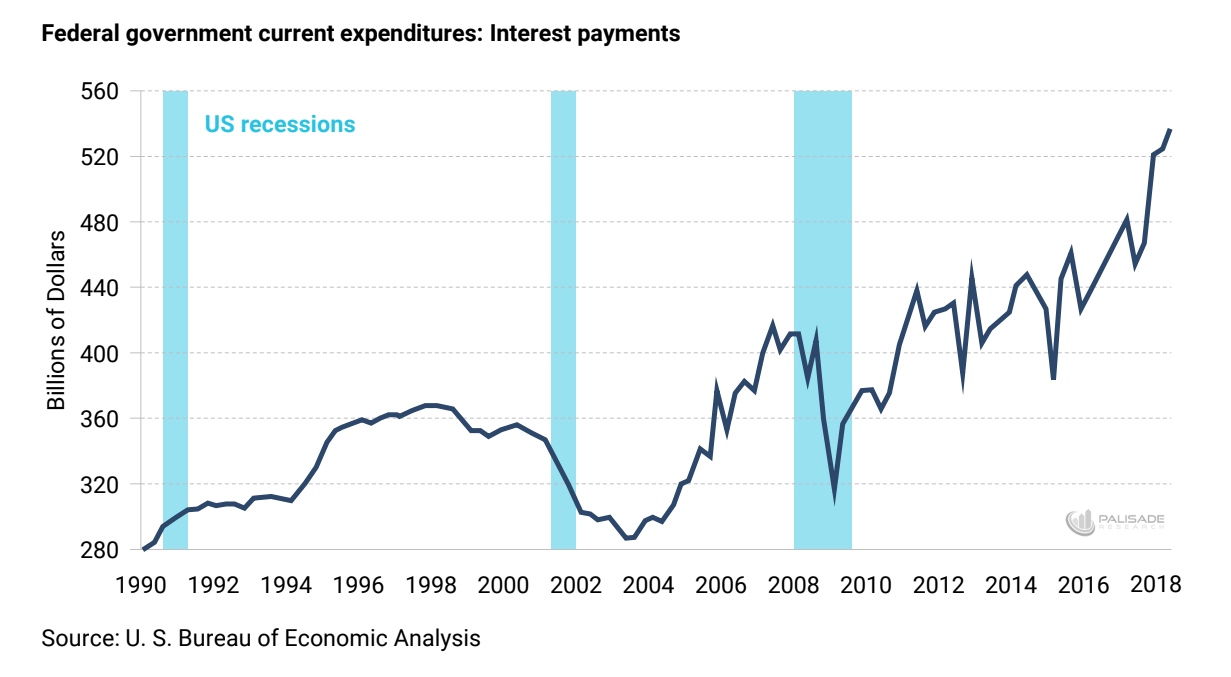
Here is another chart with recessions noted:

Source: Palisade Research

Rising interest rates should further exacerbate the interest issue. As the economy continues to grow the US should try to payoff and reduce outstanding public debt.

Related:

Robot Density in Emerging and Developed Countries

Automation is being embraced by many industries across the world. No longer automation simply involved using robots to perform complex physical and dangerous tasks in the industrial sector. Today robots are used not only for physical tasks but also for cognitive tasks according to a report on automation by Deutsche Bank. The author Jim Reid notes the following in the fascinating report:

There are differences with this coming automation revolution. Today’s robots are automating cognitive tasks rather than the physical tasks they have done in the past. But given the weight of historical evidence in favour of automation, the burden of proof  should lie on those who argue against automation improving our lives rather their those who embrace it in the hope of higher living standards.

So we say, learn to love your robot colleague. In this edition of Konzept we look at the future of automation from different angles. Our cover feature expands on the macroeconomic discussion but a common thread throughout is that robots and automation will complement humans and make the world a different place. They will not destroy the fabric of work. One statistic to consider: In 1907, Britain had 40,000 cars on the road. By 1939, this had risen to 2,000,000. Today, it is ten times that number. Could robots be the 21st century version of the car?

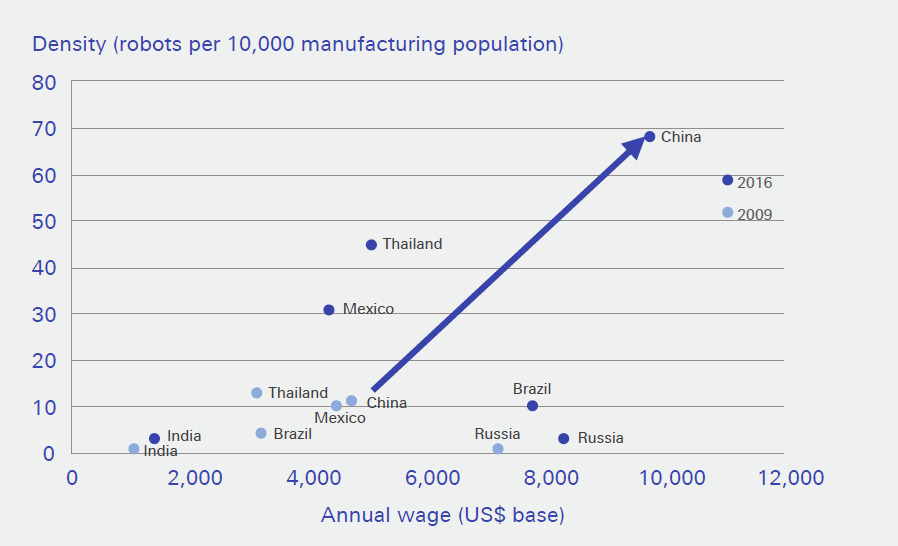
In terms of robot density China leads the emerging world. Robot usage has grown significantly from 2009 to 2016 as shown in the chart below:

Click to enlarge

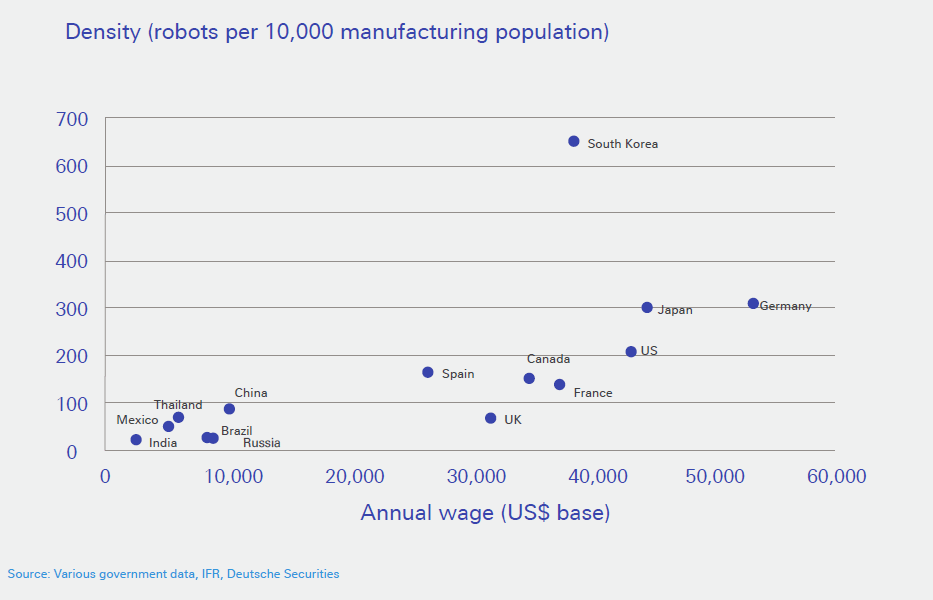
In the developed world, South Korea leads in robot density followed by Germany and Japan. US still lags in the use of robots. 


Though robot use is growing in China and other developing countries, they still have a long way to go before catching up with the developed world.

SourceAutomation – not a job killer, Will I take your job …… or work with you?, June 2018, Konzept, Deutsche Bank

Download Report: 

Related: