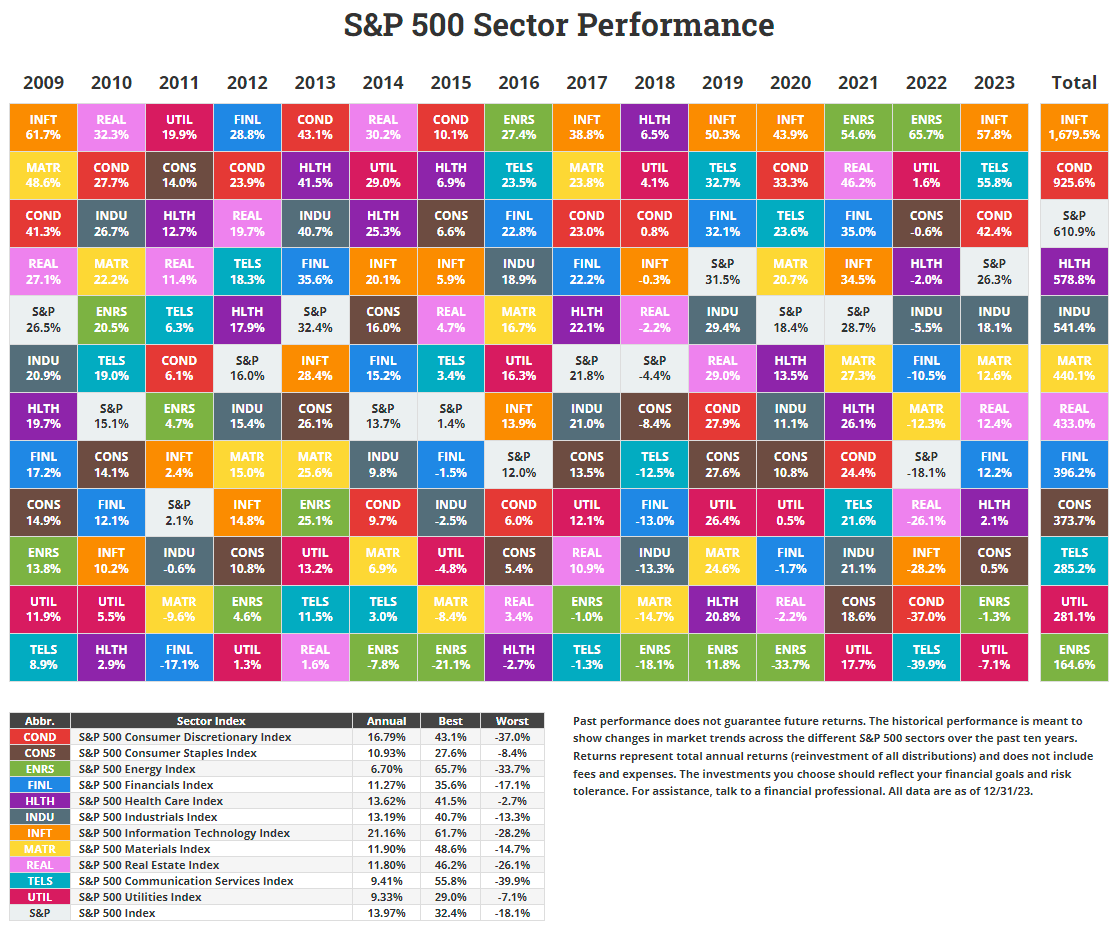
Australian Bank Stocks Offer Potential Investment Opportunities

Australian banks have been one of the poor performers among the developed world’s banks for many years. In fact, the stock prices of the major banks except Commonwealth Bank are below where they were 10 years based on prices in the domestic market. The banks have gone nowhere per most investors. The following chart shows the performance of the banks in the past 10 years on the Australian market:

Click to enlarge

Source: Can Aussie banks rediscover their glory days?, FirstLinks

However the saying that bank stocks have gone nowhere is only partially true. Because if we include dividends in the return calculation then their returns are not bad. From the above article:

Shares have gone nowhere, why invest?

Westpac and ANZ shares are down 33% and 17% respectively, in the last 10 years. With dividends, the returns are more respectable but still not great. Since August 2013, Westpac has paid fully franked dividends totaling $15.49 per share, ANZ not far behind at $15.19. This lifts 10-year total shareholder CAGR to 1.4% for Westpac and 3.6% for ANZ. National Australia Bank has done a little better with total shareholder CAGR of 4.3%. The S&P/ASX 200 total return index has returned around 8% per year for the period.

We forecast Westpac’s ROE to be 9.5% in FY24, down from 15% ten years ago. The financial services royal commission, anti-money-laundering breaches, asset divestments, and lower interest rates have driven the earnings decline. Net interest margins, or NIM, has weakened, asset divestments have halved non-interest income, and operating expenses have risen on risk, compliance and technology spend. Meanwhile, Westpac now holds an additional $24 billion in shareholder equity, a more than 50% increase. Not a pretty story and explains the share price weakness.

But we think the next five years will look different. Margins are recovering from FY22 lows and smaller banks and nonbank lenders are struggling to compete as funding costs rise. Cost savings look achievable given the bloated cost base while recent changes make it unlikely APRA will again lift capital requirements. 

Market expectations are now low, which we think is an opportunity. At the current share price, the FY24 PE of 11x and price/book of 1.0x seem to imply no operational and profit improvement. By contrast, Westpac traded on a P/E of 13x and price/book value of 2.2x in 2012 and an average price/book of 1.6x for the 10 years to 2022.

The chart below shows the year-to-date return of Aussie bank stocks available on the US markets:

Click to enlarge

5-Year returns:

Source: Google Finance

The worst performer in the past years is Westpac(WEBNF). The author of the above article projects a 30% upside for Westpac from current levels. Commonwealth bank is expensive.

So investors looking to earn a high income in the form of dividends and any potential upside in prices in the next few years can consider all banks except Commonwealth.

Referenced Stocks:

  • Westpac Banking Corp (WEBNF)
  • Australia and New Zealand Banking Group Ltd (ANZGY)
  • National Australia Bank Ltd (NABZY)
  • Commonwealth Bank of Australia (CMWAY)

Disclosure: Long NAZBY and WEBNF

The World’s Largest Uranium Producers

Countries are embracing nuclear power again after the 2011 Fukushima accident. With many reactors restarted in recent years the demand for Uranium has soared this year. According to a journal article earlier in September benchmark prices have jumped 30% to about $62 a pound. From the article:

The World Nuclear Association, an industry group, said in a report this month that generation capacity is on track to expand by three quarters by 2040. It takes between eight and 15 years for a miner to produce uranium after discovering it.

“Things are tightening up,” Jeanne Tortorelli, who manages nuclear-fuel supplies for Maryland-based Constellation Energy’s 21 reactors, told an industry event this month.

China has 24 reactors under construction to add to its fleet of 55. India plans to expand its fleet and several countries hope to install their first reactors. 

Even in Japan, where the Fukushima disaster sparked massive rallies against atomic energy, reactors that went offline until they could pass stricter safety standards are resuming operations. One-third of the country’s 33 operable reactors have restarted. Approvals are being lined up for another 16, one of which is due to resume operations this month, according to the WNA.

Source: Nukes Are Back, but Uranium Is in Short Supply, WSJ

The following chart shows the price returns of Uranium producers trading on the US markets:

Source: Google Finance

Canada-based Cameco (CCJ) is up an astonishing 73% while Uranium Energy (UEC) and Denison Mines(DNN) have increased by 37% and 49% respectively as of September close this year.

According to the World Nuclear Association, Kazakhstan is the world’s supplier of Uranium followed by Canada and other countries. Niger provides 5% of the global and is a major supplier for France, the developed world’s largest producer of nuclear energy. The following chart shows the world’s top producers of Uranium:

Source: Are Niger’s uranium supplies to France under scrutiny?, Deutsche Welle

Disclosure: No positions

How Do Assets Perform 1 Year After CD Rates Peak?

Interest rates on Certificate of Deposits(CDs) in banks have soared this year. From virtually paying nothing a few years ago CDs have become the asset to own by any investor in this high interest rate times. For instance, the rate on 1-year CDs have jumped to as high as 5.67% according to Bankrate data. With such high rates it almost sounds foolish to invest in the stock market. Growth stocks are going to get hurt by lack of access to cheap capital. Investing in other stocks are risky as well due to multiple factors from a potential government shutdown to a recession and everything in between. No wonder the equity market is in the doldrums for the past few months.

I recently came across an article at Hartford Funds which discussed on the performance of other assets 1 year after the return on 1-year CDs peaked. According to their research, the return on other assets outperformed CD returns one year after CD rates peaked. The following chart shows the performance of other assets over CDs from a select few periods in the past:

Click to enlarge

Note: The above returns do NOT include the impact of inflation and taxes which would reduce returns

Source: Is a Good CD Rate Too Good to Be True?, Hartford Funds

Related ETFs:

  • SPDR S&P 500 ETF (SPY)
  • iShares TIPS Bond ETF (TIP)
  • iShares iBoxx $ Investment Grade Corporate Bond ETF (LQD)
  • Vanguard Total Bond Market ETF (BND)

Disclosure: No positions

Utility Stocks Are Struggling in this High Interest Rate Environment

Utility stocks are traditionally owned by investors for their stability and some growth through the years. During times of adverse market conditions they remain strong providing a cushion effect to a diversified portfolio and when the market booms they offer stability with decent income in the form of dividends. Investors witnessed this scenario in 2022 when the S&P 500 declined with growth stocks especially going out of favor and utilities stood as a rock. However this year it is turning out to be different. With interest rates reaching much higher utilities have struggled year-to-date. A variety of factors have made this sector unattractive in the market. Some of these factors include:

  • High interest rates of 5% or more available on Certificate of Deposits (CDs) offered by banks
  • Unpredictable bad weather from wild fires to hurricanes to tornados hitting many states
  • Challenges in approvals of rate increases by state regulators
  • Growth of renewable energy
  • Policies favoring renewable energy over traditional energy sources

Utility stocks have also become more volatile than in the past. For instance, when wildfires devastated Hawaii a few months ago, investors in Hawaiian Electric(HE) rushed to the exit like they would normally do from a tech stock. The threat of lawsuits and negative news led to a decline of over 70% in the stock price so far this year.

That said, utilities still have a place in a portfolio for any number of reasons. The most simple one is that in most cases they are monopolies in their local markets and utilities are a necessity for living.

Utilities have underperformed the overall market so far this year. The following chart shows the performance (total returns including dividends reinvested) of a select few stocks relative to the S&P 500:

Click to enlarge

Notes:

The returns shown above are of Sept 28, 2023.

!PXTXX is the S&P 500 Total Return Index.

The chart below shows the 5-year total returns:

Click to enlarge

Source: MorningStar

From an investment standpoint, now is not the time to add utility stocks. With interest rates projected to remain high for the foreseeable future investors can wait and watch this sector.

Related stocks:

  • NextEra Energy Inc. (NEE)
  • Dominion Energy Inc. (D)
  • DTE Energy Company (DTE)
  • Duke Energy Corporation (DUK)

Related:

Disclosure: Long DTE and NEE

What Weapons Has the US Provided To Ukraine?

Ukraine announced this week that the much-awaited Abrams tanks from the US have arrived in the country. Other European countries have given tanks to Ukraine before but they haven’t given the success that they were hyped up. So the world’s advanced Abrams tanks will be put to the test in the battlefield. In addition to these tanks, the US has given various kinds of weapons to Ukraine on top of the billions in financial aid. The following infographic shows the assortment of weapons provided so far:

Click to enlarge

Source: Aljazeera