China leads the world in high-speed rail network. Recently I came across the following awesome video if high-speed train maintenance center in Wuhan. The drone video footage is simply astonishing. Curious readers may be wondering when will the US have a similar center.
Continental AG ADR Ratio Change and Stock Distribution
![]() Germany-based tire and auto-parts maker Continental AG’s ADR(CTTAY) had a ratio change recently resulting in a 2 for 1 stock split for ADS holders. CTTAY closed at $32.35 on Oct 29 and opened at $16.13 on Oct 30 before ending the day at $16.33. The depository’s announcement on the ratio change is listed below.
Germany-based tire and auto-parts maker Continental AG’s ADR(CTTAY) had a ratio change recently resulting in a 2 for 1 stock split for ADS holders. CTTAY closed at $32.35 on Oct 29 and opened at $16.13 on Oct 30 before ending the day at $16.33. The depository’s announcement on the ratio change is listed below.
The last time Continental implemented a stock split was back in 2013.
Continental – Ratio Change & 100% Stock Distribution
Deutsche Bank Trust Company Americas (“DBTCA”), as Depositary, for the sponsored Depositary Receipt (“DR”) program for Continental AG (“Continental”), is announcing a ratio change on the DR program for Continental.The ratio will change from five (5) DS representing one (1) ordinary share to the new ratio of ten (10) DS representing one (1) ordinary share.
As a result of the ratio change, Depositary Share (“DS”) holders of Continental will receive a 100% stock distribution (or 1 additional DS for each DS held) as of the DR record date.
Current Ratio: 5 DSs: 1 Ordinary Share
New Ratio: 10 DSs: 1 Ordinary Share
DR Record Date: October 26, 2018
DR Payable Date: October 29, 2018
First day of trading under the new ratio will be October 30, 2018.Fractional DS will not be issued. The CUSIP will remain the same. No exchange of the DR certificate(s) is required and any outstanding certificate issued are deemed to conform to the new ratio.
Source: Deutsche Bank
After peaking at over $60, the stock has fallen by nearly 50% after two consecutive earning warnings.
Disclosure: Long CTTAY
13 Facts About The Shipping Industry: Infographic
I came across the below cool infographic showing some curious facts about the global shipping industry:
Click to enlarge

Source: iContainers via Port Technology
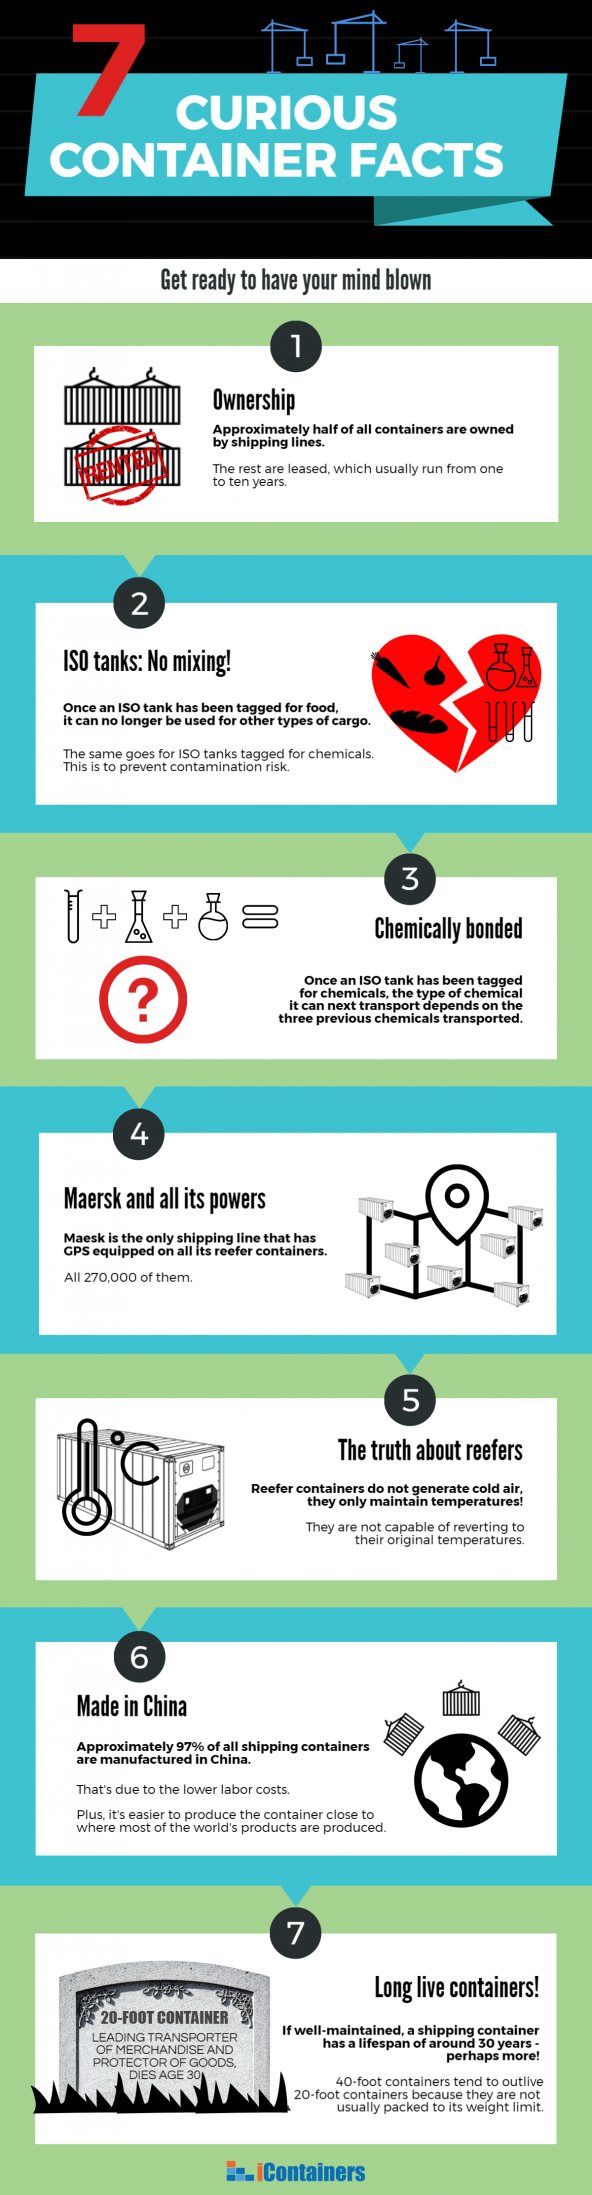
Seven Facts About Shipping Containers: Infographic
Container ships transport most of the goods across countries globally. The below infographic shows 7 curious facts about containers:
Click to enlarge
Source: Port Technology
How the US Railroad Industry Became a Monopoly: Chart
A few years ago I wrote a post about how the US railroad industry has become a monopoly with a neat map. The article was well received and continues to receive interest from readers. The following post is an update to that article.
Of the Class I railroads in the US, the following four are majors:
Out of these, BNSF is private owned by Buffet’s Berkshire Hathaway. The other three are available on the market for investors.
These four major railroads became powerful as a result of many mergers and acquisitions over the past 50 years. The following chart shows the evolution of these railroads:
Click to enlarge
The chart below shows the Network Map for the four US Railroads:
Click to enlarge
Via: The Big Picture
The following is another chart showing the merger wave in the American railroad industry:
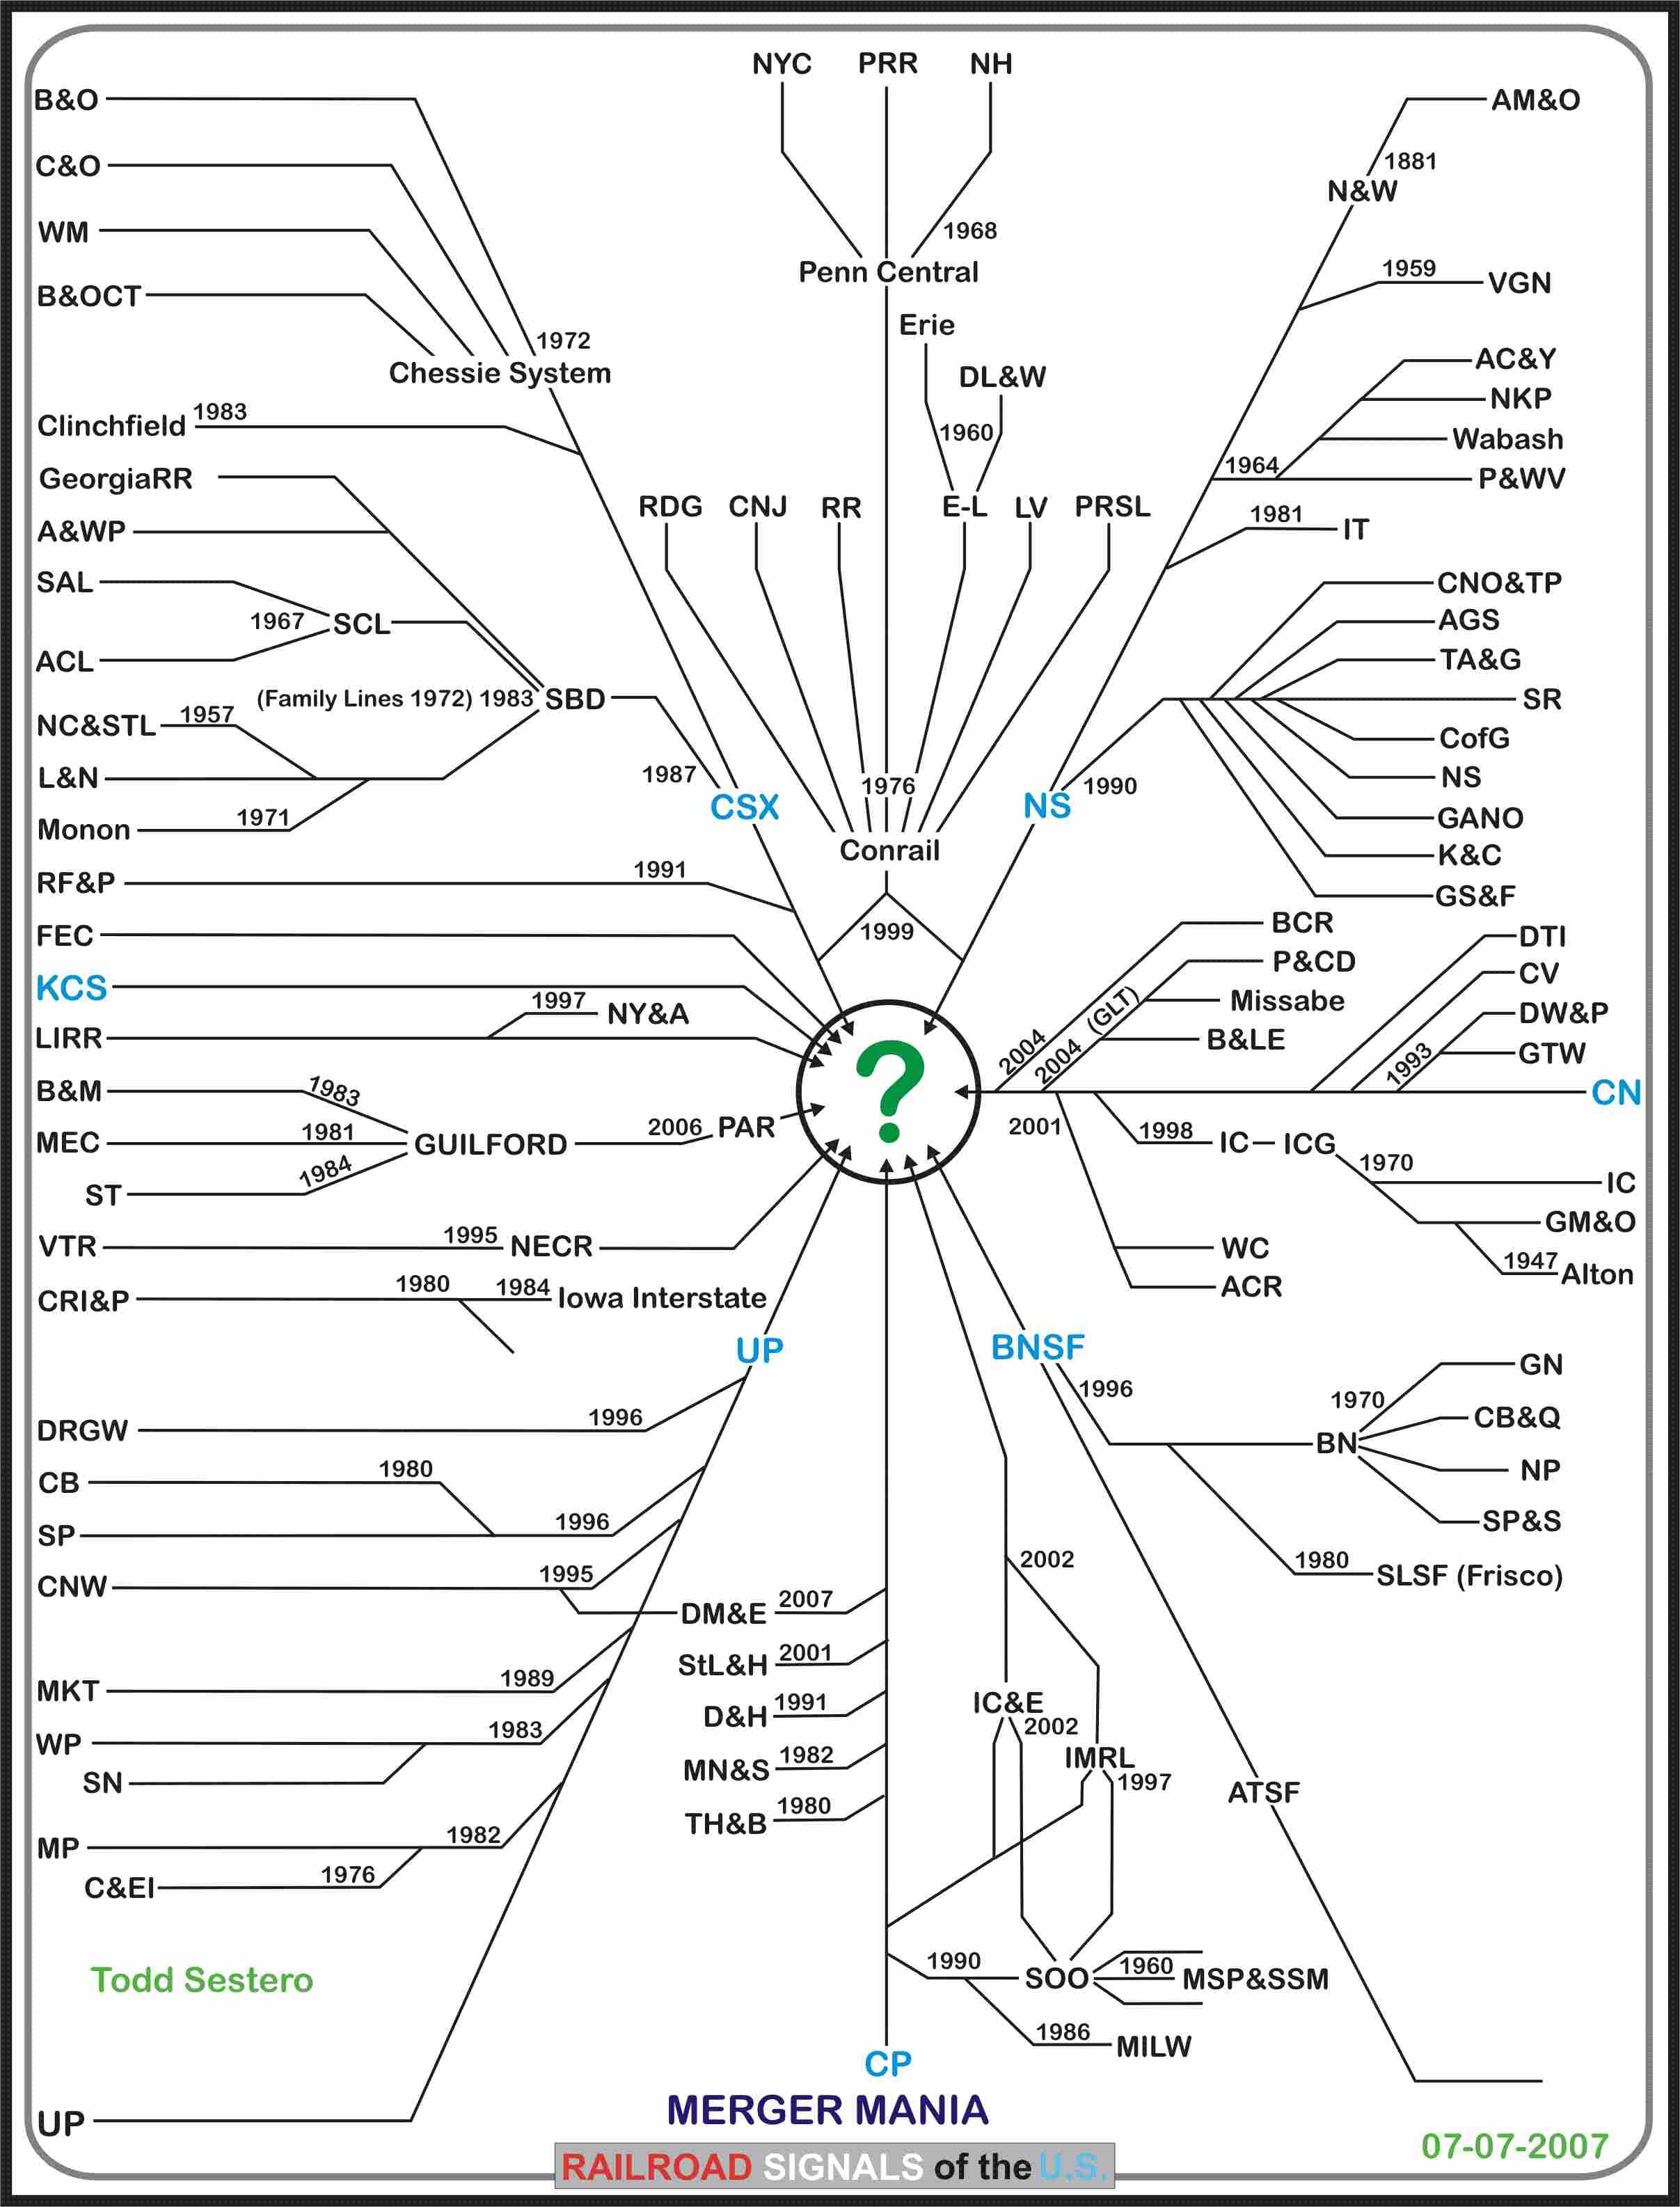
Source: RailRoad Signals
All US railroads are excellent for long-term investments. The best way to profit from railroads is simply buy a bunch of stocks and forget about them for years. After 10 or 20 years with dividend reinvested an investor will be rewarded well.
Also see:
Disclosure: Long NSC, CSX, UNP