I recently came across an fascinating infographic showing the requirements for a Russian Cosmonaut. In addition to the physical requirements the education and applied skills are tough. It would be interesting to compare this with NASA’s requirements for an astronaut.
Click to enlarge
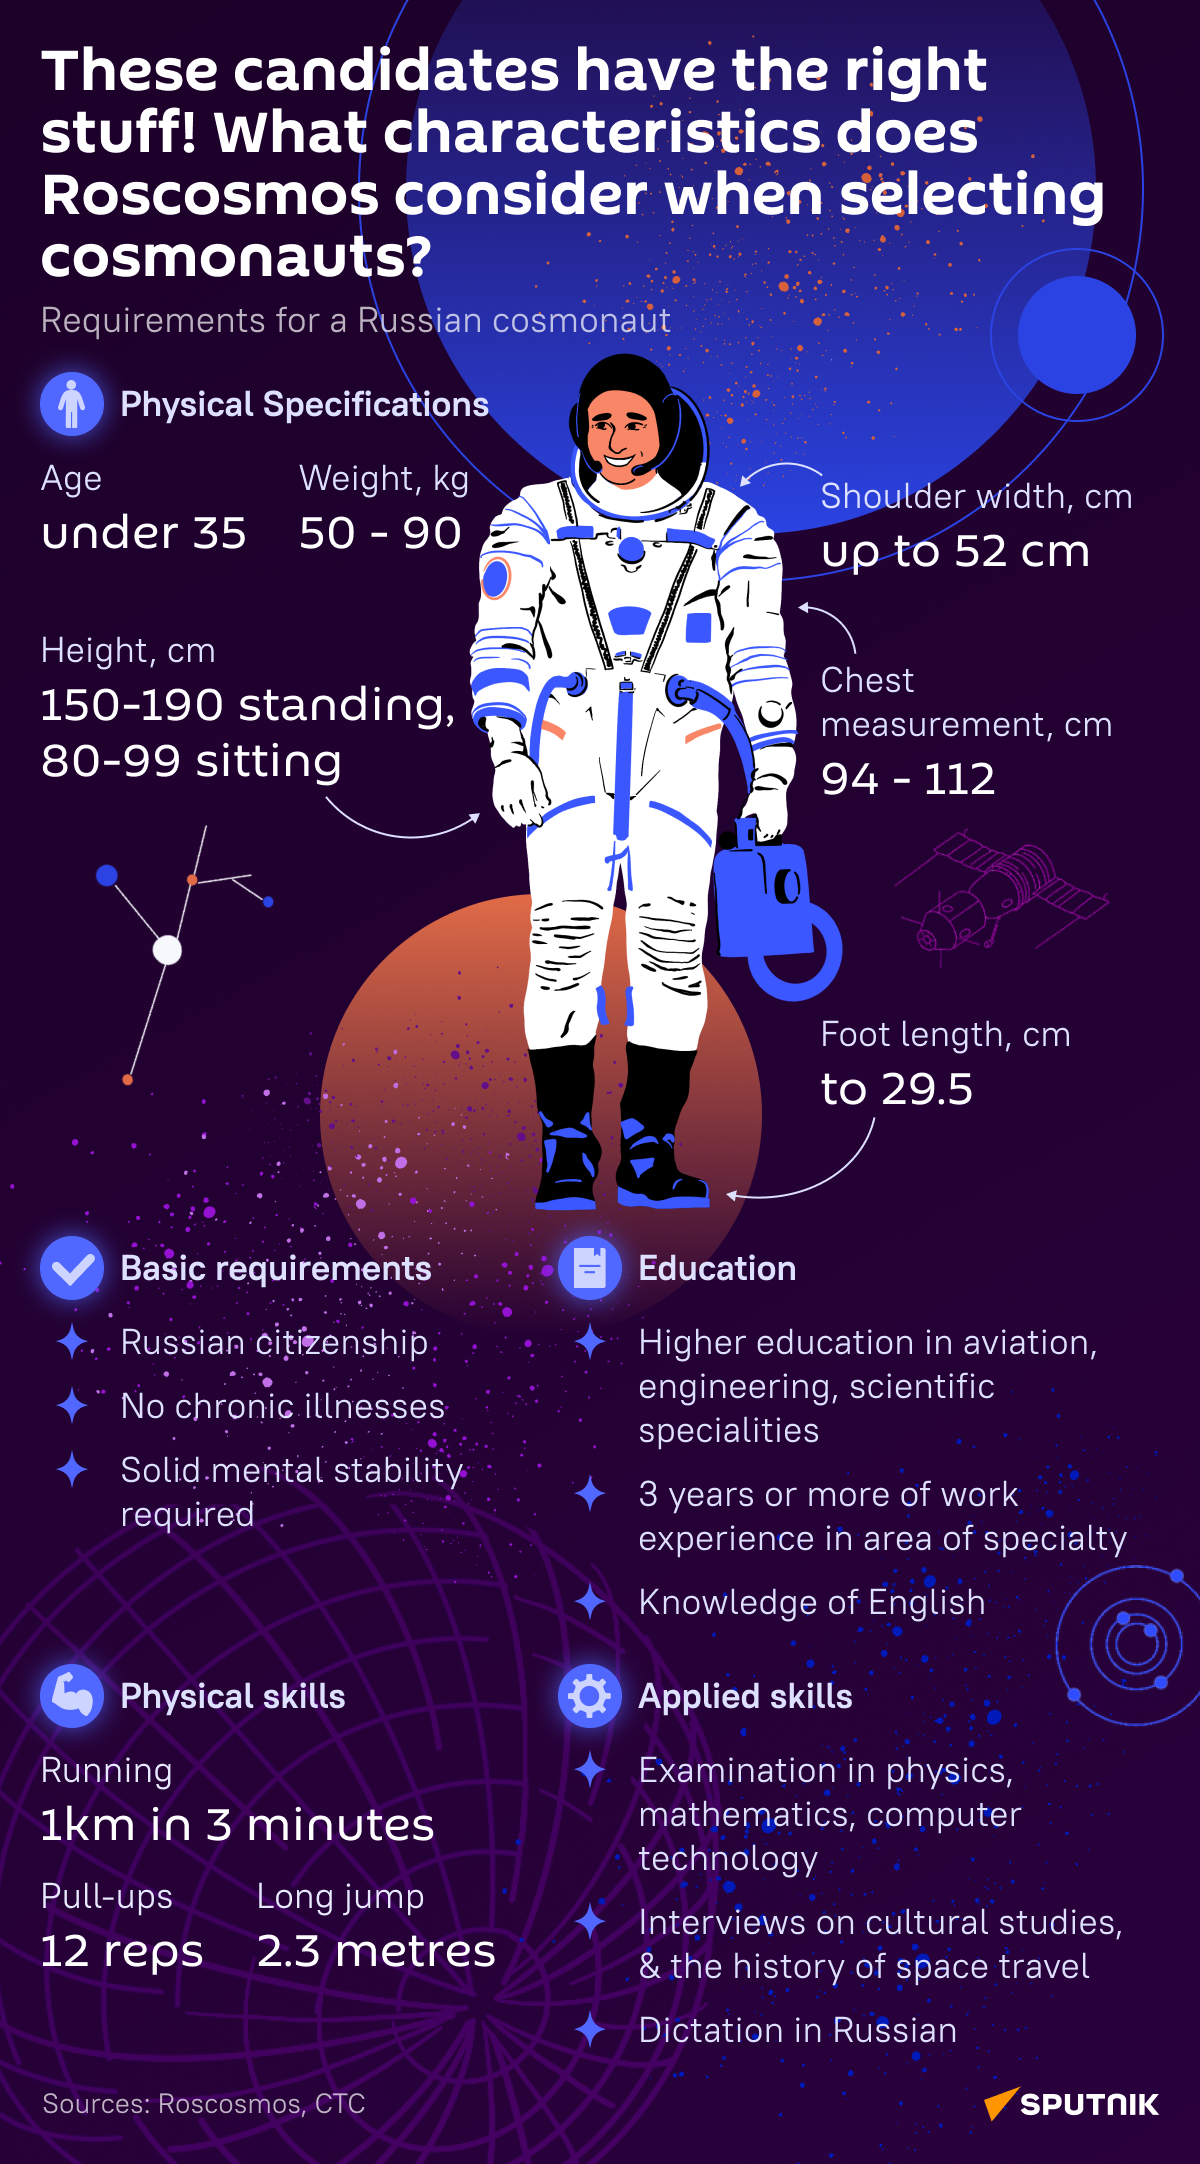
Source: Sputnik