We looked at the emerging markets returns and S&P 500 sector returns chart for 2023 in two posts earlier. In the post below let’s take a quick look at the asset class returns chart from 2009 to 2023 that was also published by Novel Investor. As expected, large caps were the winners in 2023 followed by international developed stocks. Cash was the worst performer with a return of 5.15% followed by high-yield bonds.
Over the past 15 years, large caps as denoted by the S&P 500 crushed all other assets with a return of over 610%. International developed stocks lagged by a substantial margin with a return of just 193%.
Click to enlarge
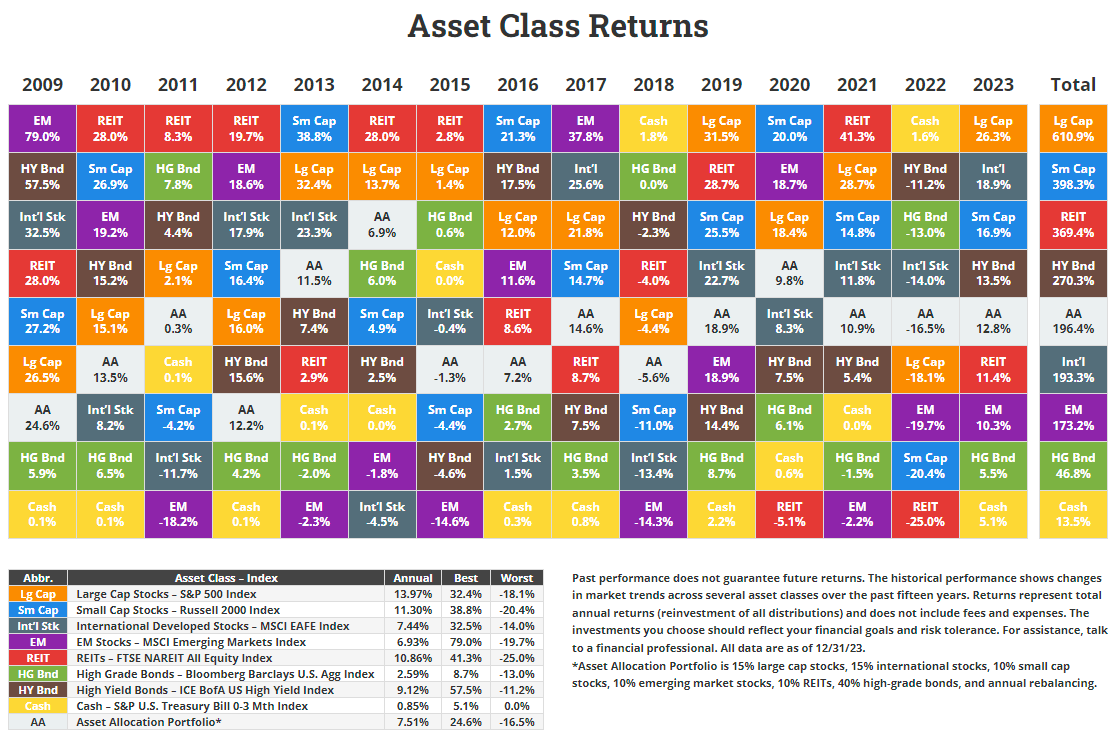
Source: Novel Investor


