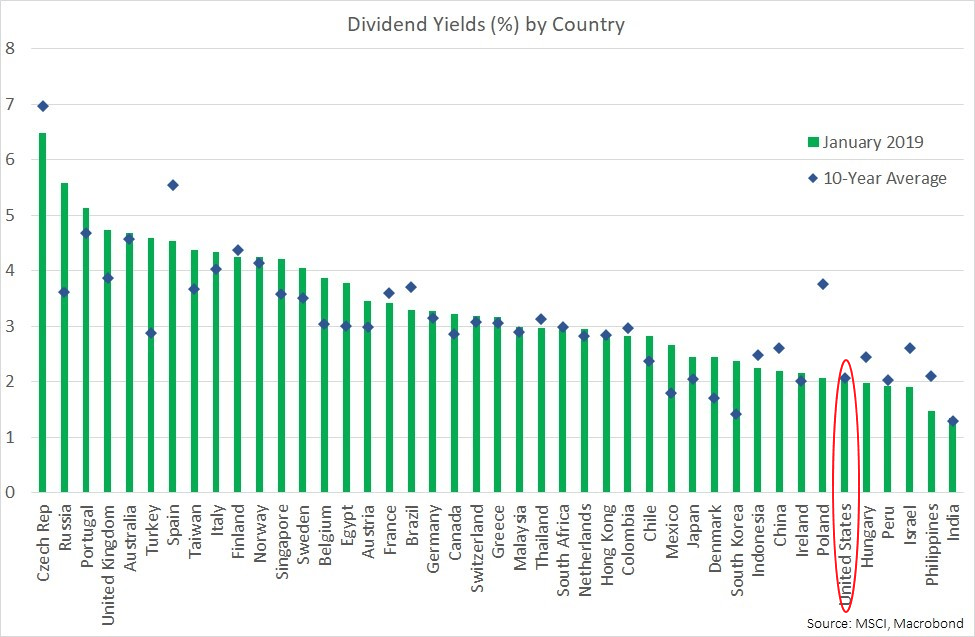
The current dividend yield of the S&P 500 is 1.90%. The yield has hovered around 2% for many years now. Since the 1990s the dividend yield has declined consistently year over year to reach the current low rates. The following chart shows the dividend yield since 1870:
Click to enlarge
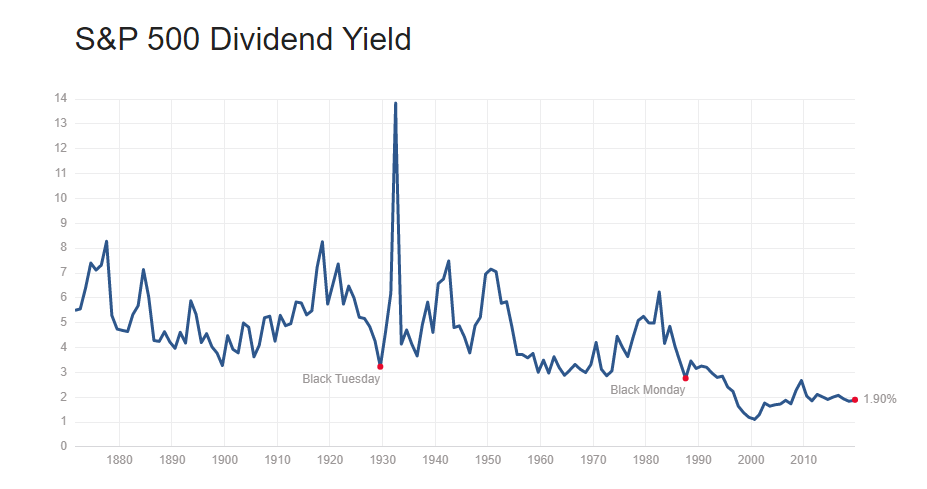
Source: multipl.com
However though the yield so low relative to other developed markets, the contribution of dividends to the overall total return over many years cannot be underestimated. In fact, even during the dot com era of the 90s dividends accounted for 16% of the total return of the index. Total return includes both price return and reinvested dividend return. During the 1st decade of the 21st century, dividends amounted to one-fifth of the total return. In the decades before, dividends played a much bigger role in total returns.
The following chart shows the ratio of dividend returns and price returns to total return of the S&P 500 by decade:
Click to enlarge
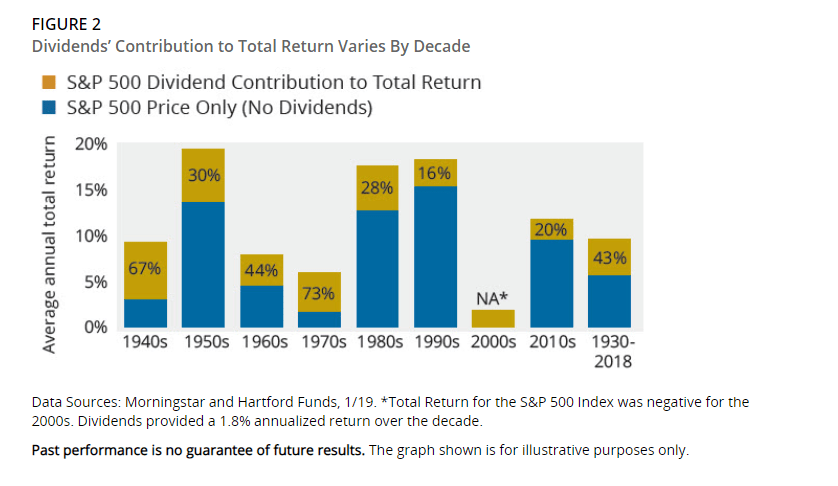
Source: The Power of Dividends, Hartford Funds
From the above article:
Decade By Decade: How Dividends Impacted Returns
Looking at average stock performance over a longer time frame provides a more granular perspective. From 1930–2018, dividend income’s contribution to the total return of the S&P 500 Index averaged 43%. Looking at S&P 500 Index performance on a decade-by-decade basis shows how dividends’ contribution varied greatly from decade to decade.
Dividends played a large role in terms of their contribution to total returns during the 1940s, 1960s, and 1970s, decades in which total returns were lower than 10%. By contrast, dividends played a smaller role during the 1950s, 1980s, and 1990s when average annual total returns for the decade were well into double digits.
Key Takeaway: Just because the dividend yield is low, investors should not NOT avoid dividend stocks or reinvesting dividends. In the long run, dividend reinvestment can be boost total return by a significant percentage.
Related ETF:
- SPDR S&P 500 ETF (SPY)
Disclosure: No Positions