Levels of Wealth Concentration Across Countries: Chart

In the modern economy, the rich keep getting richer while the poor getting poorer. Inequality in wealth and income has been growing for many decades now and the wealth disparity between the haves and have-nots is especially wider in developing countries. In many developed countries also, wealth is becoming highly concentrated with a small group of elites owning most of the wealth. Similar to developing countries, social ills like corruption, regulatory capture, favorable political and tax systems, etc. have become common in advanced countries leading to the current situation.

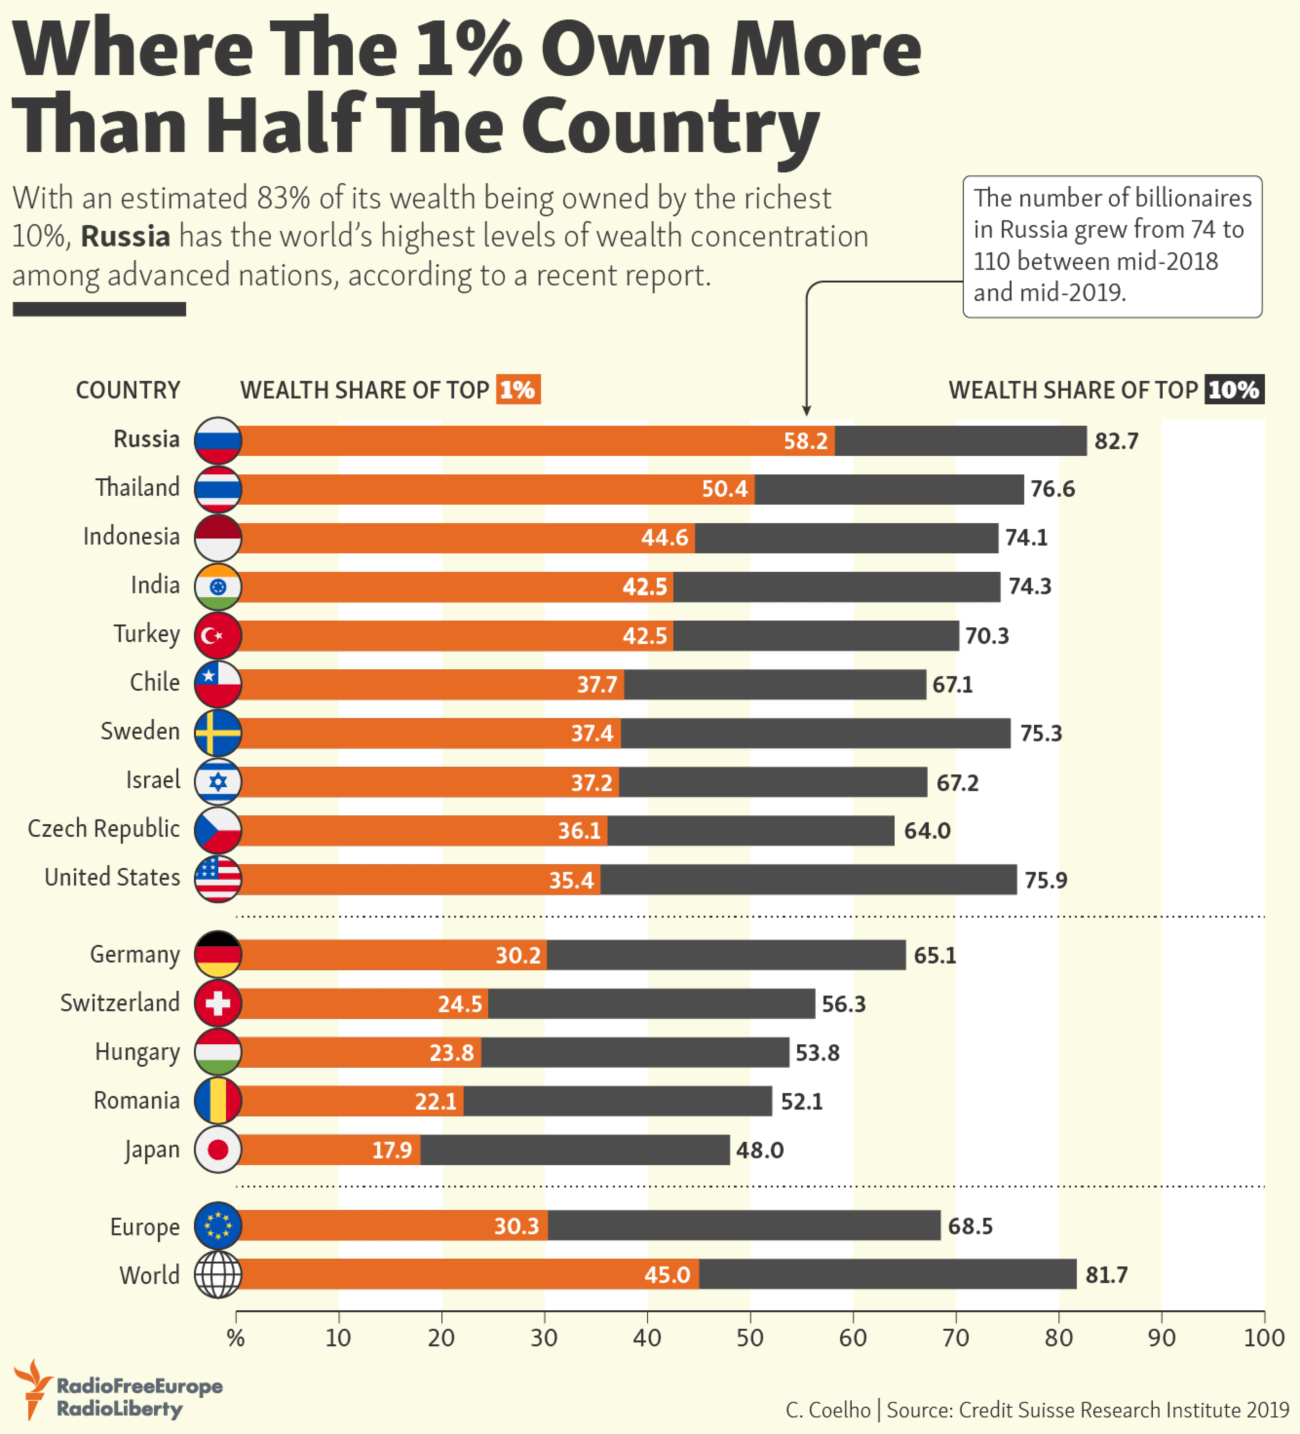
That being said, the following chart shows the share of a country’s wealth held by the top 1% and 10%:

Click to enlarge

Source: RFE/RL

Formerly communist Russia, takes the number rank for wealth concentration. The top 10% there own over 82% of the wealth with just the top 1% owing over 58% of that figure. These numbers are astonishing indeed. How times have changed !

The top six countries in this list are developing countries. India took the fourth spot. Chile which came in at number six is currently experiencing violent protests due to extreme inequality and its impacts.

In the US the top 1% owns more than one-third of the wealth.

The important question is this: If most of the wealth of a country is owned by a handful or a small group, is that a good thing for the country?

The UK Stock Market is The Worst Performing Among Developed Markets

The UK used to be a super power ruling many countries of the world. Nowadays UK has become an also ran country. The country is not a leader in technology. In defense, it is generally considered a poodle of the US. Economically the country has bogged down in the Brexit morass for the past few years. Similar to the Greek sovereign debt crisis that lasted many years the current Brexit saga continues like a cruel British joke with no end in sight. In some ways, the country has become the laughing stock of the world.

In the latest development, UK is set for a new election on December 12th. From an article in the BBC:

The UK is set to go to the polls on 12 December after MPs backed Boris Johnson’s call for an election following months of Brexit deadlock.

By a margin of 438 votes to 20, the House of Commons approved legislation paving the way for the first December election since 1923.

The bill is still to be approved by the Lords but could become law by the end of the week.

If that happens, there will be a five-week campaign up to polling day.

The prime minister has said the public must be “given a choice” over the future of Brexit and the country.

Mr Johnson hopes the election will give him a fresh mandate for his Brexit deal and break the current Parliamentary deadlock, which has led to the UK’s exit being further delayed to 31 January.

Source: UK set for 12 December general election after MPs’ vote, The BBC

From an equity market performance perspective, British stocks have lagged all the other developed markets over the past decade as the following chart shows:

Click to enlarge

Source: FTSE 100 loses earnings momentum again by Russ Mould, Shares Magazine

An excerpt from the above piece:

PRICE MUST BE RIGHT

The good news is that it is possible to make a case for UK equities being cheap, especially after a period of underperformance on the global stage that pre-dates the summer 2016 EU referendum vote by some distance. Over the past 10 years, the UK stock market, as benchmarked by the FTSE All-Share has provided a total return in sterling terms of 104%.

That lags not just the rip-roaring US equity market but Japan, Asia and even Western Europe as well (with sterling’s decline playing part). UK equities have outperformed only emerging markets, not developed ones.

As a result of this moderate showing, it can be said that UK equities look cheap relative to their international peers and to their own history on just 12.7 times forward earnings for 2020, with a dividend yield of 4.6%.

That dividend yield in particular may catch the eye of income-seekers, as it is the highest figure on offer from any of the eight major geographic equity market options and represents a premium of more than four hundred basis points (or four percentage points) relative to the benchmark 10-year Gilt yield.

Investors need to ask themselves: are the earnings and dividend forecasts which underpin those tempting valuation metrics any good?

Global investors have avoided the British market like the plague due to uncertainty over Brexit. it remains to be seen if these investors turn their attention back to the UK anytime soon.

Related ETF:

  • iShares MSCI United Kingdom Index (EWU)

Disclosure: No positions

On the Sector Breakdown of India’s S&P BSE SENSEX Index

The S&P BSE SENSEX is the benchmark index of the Indian equity market. The index is up around 9% so far this year. In this post, let’s take a quick look at the sector composition of Sensex.

According to S&P, the Sensex “is designed to measure the performance of the 30 largest, most liquid and financially sound companies across key sectors of the Indian economy that are listed at BSE Ltd.”. The index was launched on Jan 1, 1986.

From a sector composition standpoint, the Sensex is highly concentrated with Finance accounting for 45% of the index. Though finance/banking traditionally is a major sector in emerging market indices, having a nearly 50% weightage is unusual even for an emerging market. The dominance of one sector at such levels is not a sign of a healthy market. Any disruption in the sector or collapse in banking stocks would have a dramatic influence on the direction of the index.

The following chart shows the sector breakdown of the S&P BSE SENSEX Index:

Click to enlarge

Source: BSE

The other major sectors by weight are Information Technology, Oil & Gas and FMCG (Fast-Moving Consumer Goods). Though India is a major software exporter, IT accounts for just 14%. Healthcare is hardly a significant sector in the Indian equity market as represented by the 1% allocation in the Sensex.

Download: Factsheet – S&P BSE SENSEX Index

Related ETF on the US market:

  • PowerShares India ETF (PIN)
  • The iShares MSCI India ETF  (INDA)

Disclosure: No Positions

Also checkout: The complete list of Indian ADRs trading on the US markets

The Global Auto Industry is an Oligopoly

The global automobile industry is not a highly competitive industry with thousands of players. Instead just like in other major industries, the auto industry is an oligopoly where a handful of firms dominate the market. Small companies trying to enter and compete against the giants is mostly impossible. For example, in the US the market is concentrated with just three companies – Ford(F), General Motors(GM) and Chrysler, which is now Fiat Chrysler Automobiles N.V.(FCAU) after the merger of Fiat and Chrysler in 2014.

Globally 14 firms control 62 brands as shown in the chart below. Most consumers may not be aware the same company owns multiple brands.

Click to enlarge

Source: Why Hitting the Gas on Car Tariffs Could Stall Everyone, Startfor

Updated – 12/6/20:

1.Fourteen Firms Dominate the Global Auto Market:

Click to enlarge

Source: Visual Capitalist

You may also like: