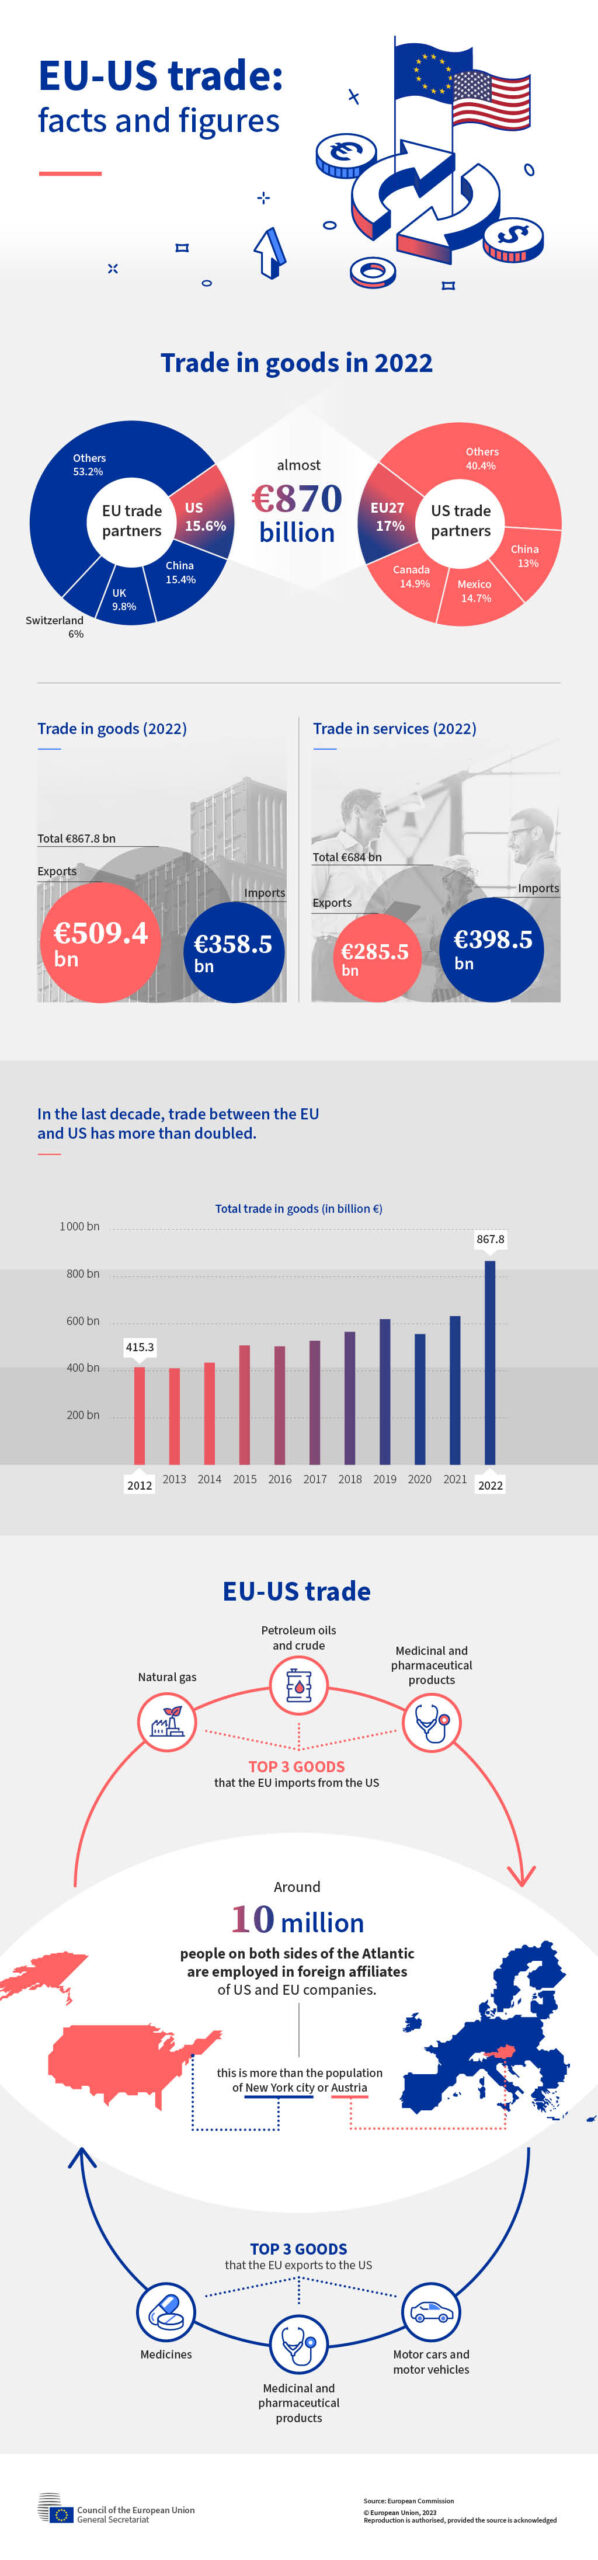
Emerging Country Equity Returns 2003 Thru 2022: Chart

The top five best and worst performing and emerging equity markets from 2003 to 2022 are shown in the chart below. In 2022, Turkey was the best performer as the country recovered from economic and currency crisis. Chile came in at second followed by Brazil. From 2003, we can observer at least one country from Latin America appears almost every year with the top returns among emerging markets.

Note: The returns shown above are in British Pound Sterling

Data Sources: MSCI. Data for individual countries from 2003 through 2022 came from MSCI Price Indices, which measure market price performance only.

Source: Lazard Asset Management

Related ETFs:

  • iShares MSCI South Korea ETF (EWY)
  • iShares MSCI Taiwan ETF (EWT)
  • iShares MSCI India ETF  (INDA)
  • iShares MSCI Emerging Markets ETF (EEM)
  • Vanguard MSCI Emerging Markets ETF (VWO)

Disclosure: No Positions

Annual Returns of Developed Markets 2002 to 2021: Chart

One of the strategies for success with investing in stocks is diversification. It is probably the easiest way to reduce risk while allowing room to capture any profit potential. The most popular chart that visually demonstrates the importance of diversification is The Callan Periodic Table of Investment Returns. Similar to the performance variance of sectors year over year, the returns of country indices also vary. A country’s equity market may be the top performer in one year while becoming the worst next year. No country consistently remains as the best market every year.

The following chart shows the annual returns of 22 developed markets from 2002 to 2021:

Click to enlarge

Past performance is no guarantee of results. In USD. MSCI country indices (net dividends) for each country listed. Does not include Israel, which MSCI classified as an emerging market prior to May 2010. MSCI data © MSCI 2021, all rights reserved.

Source: Which Country Will Outperform? Here’s Why It Shouldn’t Matter, Wealthscape

Comparing Corporate Taxes In Europe: Chart

Corporate tax rates vary across the countries in Europe. Some countries have friendly corporate tax regimes while others do not. According to the Tax Foundation, Portugal has the worst corporate taxes while Latvia and Estonia have the best rates.

Click to enlarge

Source: Comparing Europe’s Tax Systems: Corporate Taxes, Tax Foundation

A short excerpt from the above piece:

Latvia and Estonia have the best corporate tax systems in the OECD. Both countries have a cash-flow tax on business profits. This means that profits only get taxed when they are distributed to shareholders. If a business decides to retain or reinvest its profits instead of paying dividends to shareholders, there is no tax on such profits.

In contrast, Portugal has the least competitive and neutral corporate income tax system in Europe (Colombia ranks the lowest in the OECD). At 31.5 percent, Portugal levies one of the highest combined corporate tax rates on business profits, including multiple surtaxes. Only limited net operating losses can be carried forward and carried back; purchases of machinery, buildings, and intangibles cannot be fully expensed.

What Does One Barrel of Oil Yield: Graphic

Oil is one of the world’s most followed commodities for obvious reasons. The widely used measurement of crude oil is the barre. Have you ever wondered what is produced from a barrel of oil? The following graphic has the answers. It is fascinating to see that gasoline yield is less than half of a barrel of oil.

Click to enlarge

Source: US EIA via Market Index

Earlier:

Related:

Disclosure: No Positions

Regional Bank Stocks Are In A Sea of Red

The banking sector is one of the worst performing sectors year-to-date. The effects of the banking crisis earlier this year are still being felt by the banks and to add to the pain, rising interest rates have only made it worse. The S&P 500 is up by just over 10% YTD on price basis as of last Friday. However the KBW Nasdaq Bank Index bank is down by 28%. Many of the regional bank stocks are down even more.

The following table shows the year-to-date price change of the major regional bank stocks:

S.No.NameTickerStock on Price on Oct 20, 2023 closeYear-to-date Change
1US BancorpUSB $30.93 -30.7%
2PNC Financial Services Group IncPNC $111.82 -29.9%
3Truist Financial CorpTFC $27.16 -37.7%
4M&T Bank CorpMTB $113.77 -21.5%
5First Citizens Bancshares Inc Class AFCNCA $1,308.66 74.1%
6Fifth Third BancorpFITB $23.29 -28.6%
7Huntington Bancshares IncHBAN $9.64 -31.6%
8Regions Financial CorpRF $14.44 -32.7%
9Citizens Financial Group IncCFG $23.76 -39.8%
10KeycorpKEY $9.89 -43.8%
11New York Community Bancorp IncNYCB $10.10 16.9%
12East West Bancorp IncEWBC $51.48 -22.0%
13Webster Financial CorpWBS $38.19 -18.4%
14First Horizon CorpFHN $10.57 -56.7%
15Cullen Frost Bankers IncCFR $86.10 -33.8%
16Commerce Bancshares IncCBSH $45.31 -32.9%
17Comerica IncCMA $37.95 -42.5%
18Southstate CorpSSB $65.56 -13.8%
19Prosperity Bancshares IncPB $50.73 -29.6%
20Pinnacle Financial Partners IncPNFP $61.64 -13.5%
21Western AllianceWAL $42.22 -27.8%
22Wintrust Financial CorpWTFC $74.14 -11.4%
23Zions BancorporationZION $29.96 -38.1%
24Popular IncBPOP $60.55 -7.7%
25Home Bancshares IncHOMB $20.58 -8.4%
26FNB CorpFNB $10.69 -17.9%
27Bank OzkOZK $35.60 -9.4%
28Synovus Financial CorpSNV $25.49 -31.1%
29United Bankshares IncUBSI $26.22 -34.6%
30Valley NationalVLY $7.82 -30.7%
31Glacier Bancorp IncGBCI $29.74 -39.4%
32First Financial Bankshares IncFFIN $23.13 -32.1%
33UMB Financial CorpUMBF $60.91 -26.2%
34BOKFinancial CorpBOKF $72.90 -26.3%
35TFS Financial CorpTFSL $11.07 -23.2%

Note: All the banks listed above are in the iShares U.S. Regional Banks ETF (IAT).

A few observations:

  • Of the stocks listed above only First Citizens Bancshares Inc Class A and New York Community Bancorp Inc are in the positive region YTD. First Citizens is an exception since it soared after its acquisition of the failed Silicon Valley Bank.
  • The worst performer so far is First Horizon Corp which has plunged by over 56%. Others such as Keycorp and Comerica Inc have declined by over 40% as well.
  • Many of the worst performers are mainly due to their exposure to commercial real estate industry.
  • Overall its not a pretty picture as regional bank investors are nursing heavy losses so far this year.

Disclosure: Long USB and GBCI