European companies offer many of the features that are common in their US peers. Among the developed countries, firms in Europe are the closest to American counterparts in terms of quality, governance, growth, scale and other factors.
I have written many times before about the need for investors to hold European stocks. Some of the reasons that tilt the scale towards companies from the continent include: higher dividend yields, strong global presence due to centuries of colonization of countries around the world, equal or even better governance in some firms, ability to plan and invest in R&D for the long-term as opposed to the rat race of worrying about beating quarterly numbers like US firms, etc.
Some of the factors were noted in an interesting article on international investing at American Funds. From the article:
2. Revenue has become more important than real estate
If real estate is all about “location, location, location,” investing may be all about “revenue, revenue, revenue.” As the shift toward globalization continues, the address of a company’s headquarters has become less important to its growth prospects than where it makes money.
Consider that a company’s products are often made with parts manufactured in several countries and then sold to customers around the world. This rise of multinational companies means investors should re-evaluate how they think about global stocks. Instead of where a company is based, look at where it earns its revenue.
For example, the 10 largest companies in Europe generate less than a third of their revenue from their home region. Political strife or an economic slowdown can still hinder European stocks, but will affect every business differently. A careful examination of revenue exposure can help identify companies that are less likely to be disturbed by macro headwinds.
The bottom line? Follow the money, not the mail.
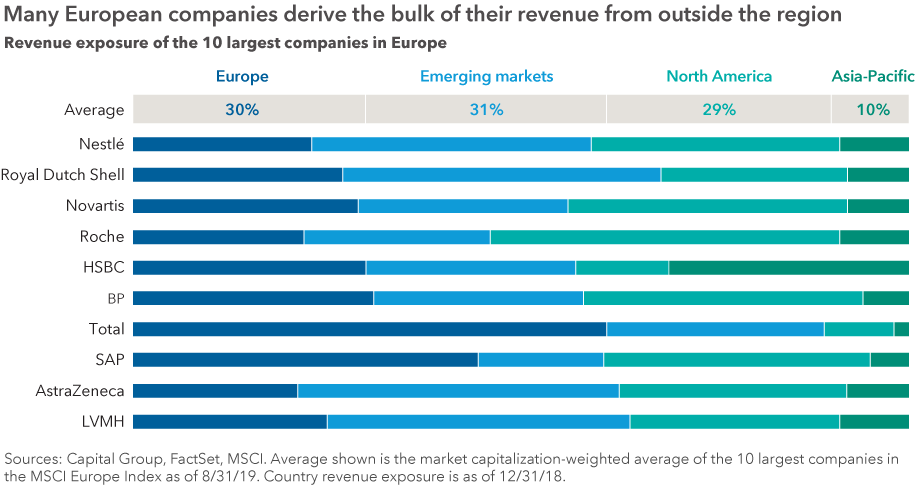
Source: International investing in 2020: Your comprehensive guide by Rob Lovelace and David Polak, Capital Group
Clearly the above chart shows that the top 10 European firms’ earnings are impacted more from macro conditions outside of the continent. For instance, food giant Nestle(NSRGY) derives less than one-third of its revenues from Europe.
So from an investment perspective, investors looking to diversify and gain exposure to world-class firms can consider adding the above stocks at opportune times.
The top 10 European firms are listed below with their tickers on the US market and the dividend yields:
1.Company: Nestle SA (NSRGY)
Current Dividend Yield: 2.33%
Sector: Food Products
Country: Switzerland
2.Company: Royal Dutch Shell PLC (RDS.A)
Current Dividend Yield: 6.56%
Sector: Oil, Gas & Consumable Fuels
Country: The Netherlands
3.Company: Novartis AG (NVS)
Current Dividend Yield: 3.08%
Sector: Pharmaceuticals
Country: Switzerland
4.Company: Roche Holding AG (RHHBY)
Current Dividend Yield: 2.79%
Sector: Pharmaceuticals
Country: Switzerland
5.Company: HSBC Holdings PLC (HSBC)
Current Dividend Yield: 6.92%
Sector: Banking
Country: UK
6.Company: BP PLC (BP)
Current Dividend Yield: 6.63%
Sector: Oil, Gas & Consumable Fuels
Country: UK
7.Company: Total SA (TOT)
Current Dividend Yield: 5.48%
Sector:Oil, Gas & Consumable Fuels
Country: France
8.Company: SAP SE(SAP)
Current Dividend Yield: 1.26%
Sector: Software
Country: Germany
9.Company: AstraZeneca PLC (AZN)
Current Dividend Yield: 2.94%
Sector: Pharmaceuticals
Country: UK
10.Company: LVMH Moet Hennessy Louis Vuitton SA (LVMUY)
Current Dividend Yield: 1,56%
Sector: Software
Country: France
Note: Dividend yields noted above are as of Dec 9, 2016. Data is known to be accurate from sources used.Please use your own due diligence before making any investment decisions.
Disclosure: No Positions