S&P 500 Sector Performance by Year from 2009 to 2023: Chart

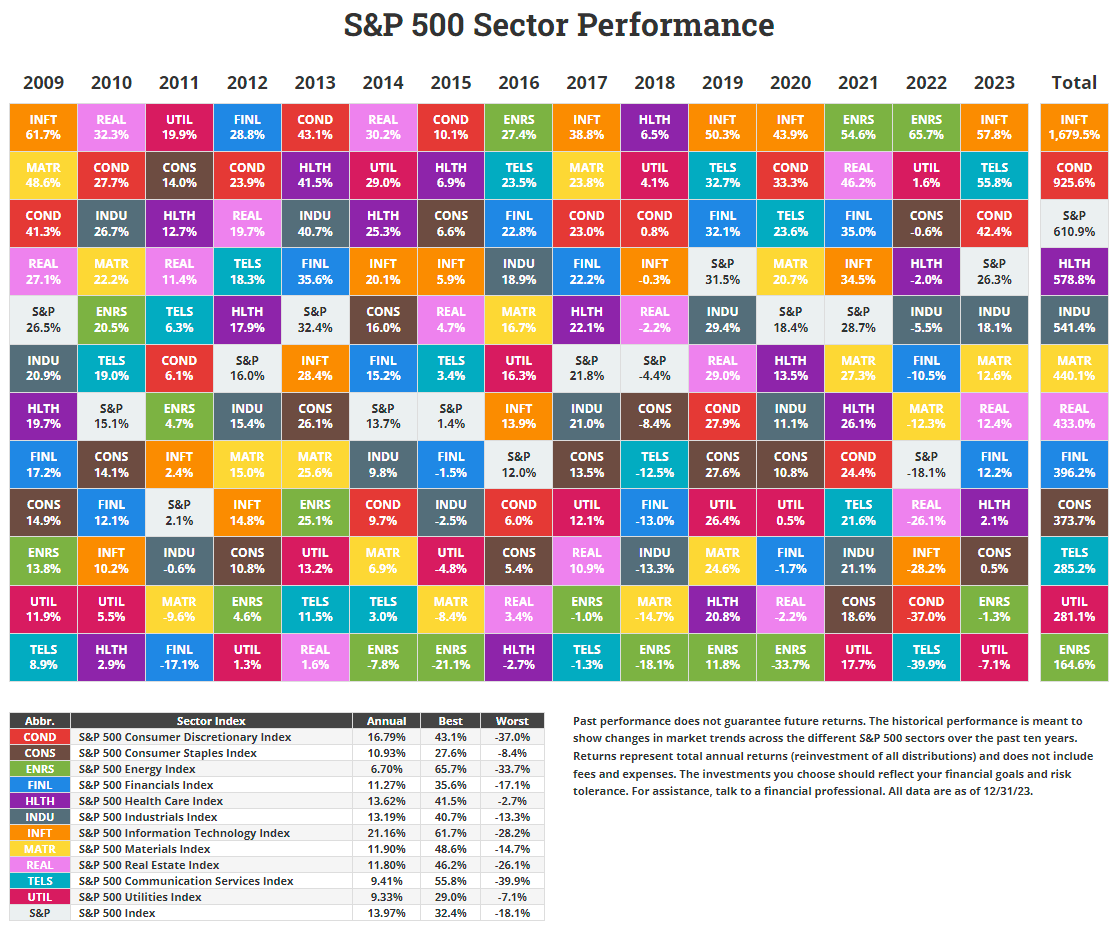
The latest edition of the annual S&P sector performance chart for the S&P 500 was published by Novel Investor this week. In 2023, the best performing sector was the tech sector as represented by INFT, the S&P 500 Information Sector Index. The sector annual return’s was over as astonishing 57%. The next top performers were communication services and consumer discretionary index. The strong returns of consumer discretionary sector shows consumers for the most part did not reduce spending with high inflation levels.

The worst performing sectors were utilities, energy and consumer staples in that order. Utility stocks have not received much love from investors lately since as income stocks they have sever competition from CDs, bonds and other asset classes that pay comparable rates or even better returns. For instance, a 1-year CD paying 5% is irresistible to an investor that might have put the money in utility stocks in the past.

Note: The returns shown below are based on Total Returns which includes dividends reinvested.

Click to enlarge
Novel Investor Sector Returns QuiltSource: novelinvestor.com

Source: Novel Investor

Related ETFs:

  1. SPDR S&P 500 ETF (SPY)
  2. iShares Core S&P 500 ETF (IVV)
  3. Vanguard S&P 500 ETF (VOO)
  4. SPDR Portfolio S&P 500 ETF (SPLG)

The Complete List of stocks in the S&P 500 Index as of Jan, 2024 can be found here.

Disclosure: No positions

The US National Debt Surpasses $34 Trillion: Infographic

The US welcomed the new year with yet another grim milestone. The US Gross Federal Debt has crossed $34.0 Trillion (or) $34,000,000,000,000. This number is “meaningless” for many people as the number is so huge its impossible to comprehend. Some may say “who cares”. They might as well run it to $100 Trillion. In an ideal world, the state and policymakers would draw up plans to reduce this debt mountain. The following updated infographic from Peter G.Peterson Foundation offers different takes to understand the nation debt and its impacts:

Click to enlarge

Source: THE NATIONAL DEBT IS NOW MORE THAN $34 TRILLION. WHAT DOES THAT MEAN?, Peter G.Peterson Foundation

Germany Lags Behind in EV Sales and Adoption

Electric Vehicle (EV) sales are booming in many parts of the world. China is the leading the world and Europe is also playing catch. Countries such as Norway are already ahead of many other countries in Europe in EV adoption. Ironically Norway is one of the major oil producers with state-owned Equinor(EQNR) as one of the top revenue generators for the economy. Equinor used to be knows as Statoil. The economic powerhouse of Europe, Germany though is still way behind in EV adoption. Similar to the US, Germany is wedded to fossil fuels. According to a recent article in Deutsche Well, just 2.08% of the total number of cars on the road in Germany are EVs. This is indeed shocking for a country that is the leader of Automotive engineering where some of the world’s great luxury automakers are based. Below is a brief excerpt form the piece:

‘A sense of hopelessness in Germany’

Bratzel says that German car manufacturers “started too late compared to players such as Tesla or some Chinese manufacturers” and then “did not approach the topic with the necessary focus.”

Notwithstanding efforts to boost battery technology development in particular, “you first have to catch up with the speed of the Chinese [companies] and Tesla,” he says.

Dudenhöffer concurs that China has a clear advantage.

“We are cutting back. Investments are being postponed and investments are being made in China. The budget problems and the lack of a federal budget are exacerbating the problem,” he says, adding that “Germany is at a standstill. And things will get really tough after 2025 when the Chinese will be dominating the global market for electric cars.”

Dependence on China

On November 30, car manufacturers BMW and Mercedes-Benz announced plans to set up a joint network of fast-charging stations for electric vehicles in China — a logical development, says Dudenhöffer.

“Germany is not the country where such investments are worthwhile. In China, electric cars now account for a market share of almost 40%.”

Bratzel also highlights the danger of too much dependence on China, although he adds that it’s a two-way relationship.

“China is also dependent on us.” But there is a caveat, he says. “In the field of electromobility, we are more dependent on China. That will remain the case for a few more years, especially when it comes to battery cells.”

The development and production of batteries is key, says Dudenhöffer. “We are expanding more slowly. Production is going to Eastern Europe because energy is cheap there. But China is already at the forefront and its importance will continue to grow.”

Source: German auto industry: Will 2024 mark a turning point?, DW

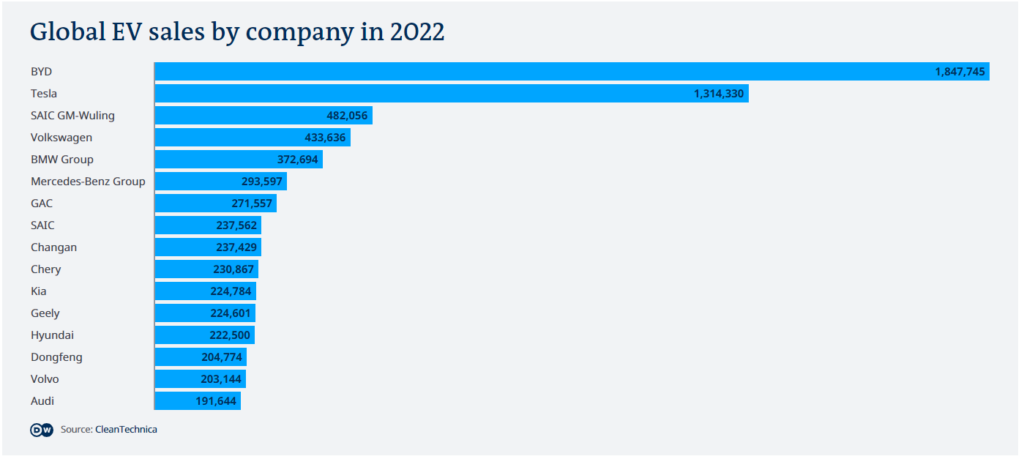
As mentioned above, China is the top producer of EVs in the world. In 2022, Chinese automaker BYD was the top ranked automaker with sales of over 1.8 million EVs globally. Tesla(TSLA) was the second ranked EV automaker followed by China-based SAIC GM-Wuling. The three major German auto giants took the next three spots as shown in the chart below:

Global EV Sales by Company in 2022: Chart

Click to enlarge

Source: German auto industry: Will 2024 mark a turning point?, DW

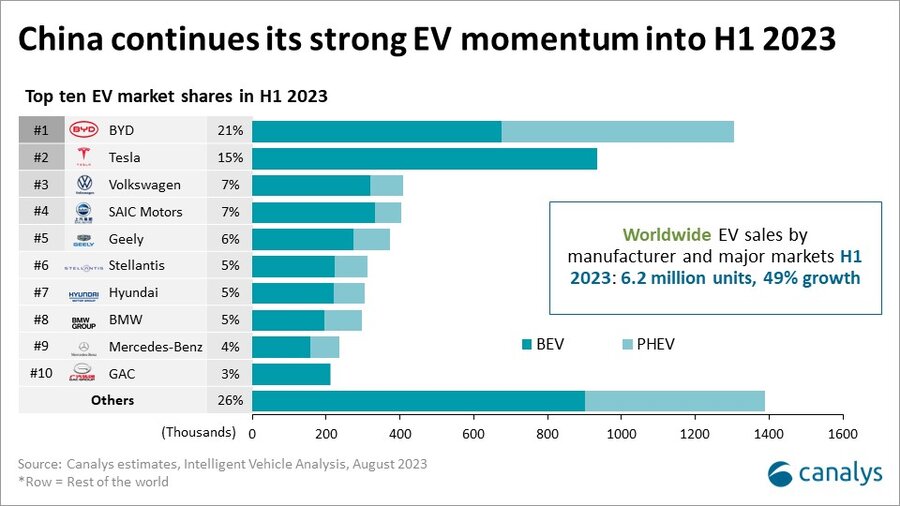
In the first half of 2023, China’s BYD was the top seller was well as shown in the chart below followed by Tesla.

Click to enlarge

Source: Global EV sales up 49% to 6.2 million units in H1 2023, with 55% of vehicles sold in Mainland China, Canalys

I will post update when full year 2023 data is out some time next year.

Disclosure: No positions

Economic Growth vs. Stock Market Returns: China and India

The economic growth of a country and its equity market returns are not directly linked. Conventional wisdom would imply that higher economic growth leads to higher equity market returns and vice versa. But that is not always the case. In fact, the relationship between a country’s GDP growth and its equity market returns is weak or in some cases non-existent To put it another way, the stock market can soar to sky high levels even with lower GDP growth. I written many times on this topic in the past some of which can be found here and here and here and here.

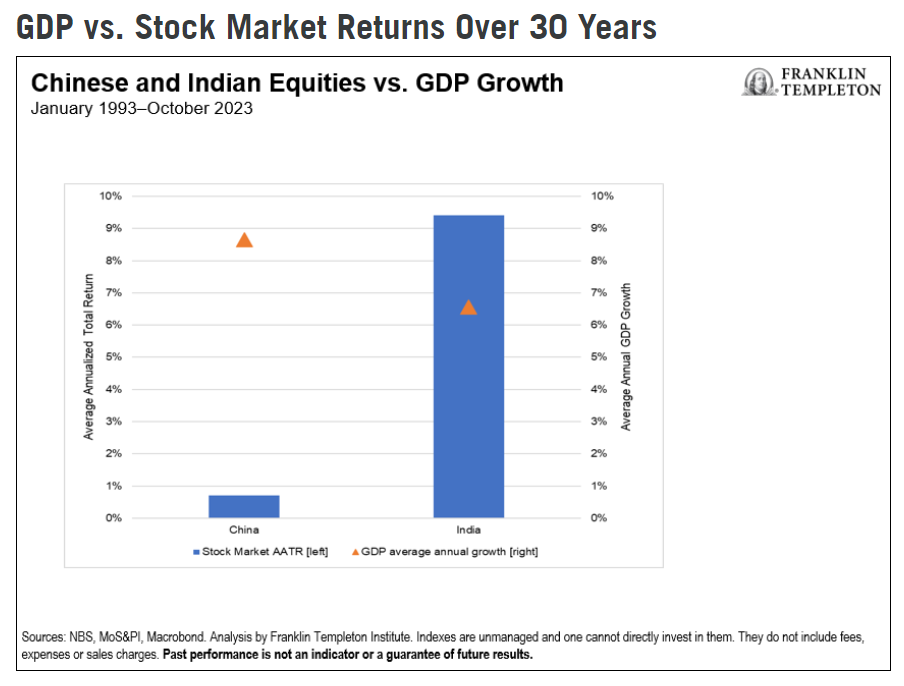
China and India are two of the major emerging markets. In terms of economic growth, the Chinese economy has had astonishing growth up until a few years ago. India’s economy also grew but at a much lower rate. However the returns on the Indian equity market has been much higher than that of China’s. A recent article at Franklin Templeton confirmed my long-held assumption. From the article:

In the chart below, while Chinese GDP growth as averaged 8.65% per annum in the last 30 years, the equity market’s average total return has been +0.7%. By contrast, India has had GDP growth of 6.5% per annum, yet the equity market has delivered an average total return of 9.4% in the same period.6

6. Past performance is not an indicator or a guarantee of future results.

Source: Consider This: Is India the new China? by Kim Catechis, Franklin Templeton

Mr.Kim also points out that India’s stock market is full of companies with lower floats. In many listed firms, the major shareholders are the promotors or insiders of the company. The promotors control 50% or more in the public companies. The middle-class investors have a very low participation rate in India’s stock market. They own only 10% through mutual funds and direct investments in stocks.

Another fact is that 90% of publicly listed companies in India are controlled by families according to one study. The low floats and high family ownerships make India’s stock market highly concentrated. While the equity returns are higher in India as shown above, the high concentration in the hands of a few poses a risk in the long run.

Related ETFs:

  • iShares S&P India Nifty 50 (INDY)
  • iShares MSCI India ETF (INDA)

Disclosure: No positions