How Did The Stock Market Perform During The Spanish Flu of 1919 ?

Millions of Americans have lost their jobs as Covid-19 decimated the US economy almost overnight. The tiny invisible virus did more damage to the economy than even 9/11. The number of unemployed Americans is about 43 million. As the adverse effects of the Pandemic continues to impact every corner of the world’s largest and dynamic economy, the stock market seems to have recovered from the lows reached during the panic in March.

The S&P 500 down by just 8.57% on price basis year-to-date. Today the market soared on a positive new on the vaccine front. Sometimes it makes you wonder if the market is brushing aside the Pandemic itself like a minor flu or fever, While the talking heads and others tell us that the market is soaring because it can’t get any worse, vaccine tests are showing potential, US states and other countries are opening up and that is a huge positive, etc. In reality, markets are rising on thin volumes and vaccine for this disease is still one year or more away.

With that brief introduction, let’s turn our attention to how market may perform in a pandemic situation such as the current one. The last pandemic that devastated the globe is The Spanish Flu of 1919. Millions of people around the world were infected and millions died. While Covid-19 is unlikely to reach that levels, it is still important to study the Pandemic of 1919 and its impacts on the market.So far most of the countries have been hit by the first wave of Covid-19. However there are fears of a second wave if economies are opened up prematurely or people go back to living like normal.

An interesting article by Dr. Brian Taylor, in Investment Office analyzes the Spanish Flu and its impact on the US equity market. From the article:

The Spanish flu came in three waves as is illustrated in Figure 1.  The first wave, which made people notice the flu, occurred in July 1918.  The second and most deadly wave occurred in October 1918 and resulted in millions of deaths.  A final wave of the flu occurred in February 1919, and after that, the flu disappeared.  Either the virus mutated to a less lethal form or doctors got better at treating or preventing it.  Just as no one knows for sure exactly where the virus came from, no one knows why it disappeared.
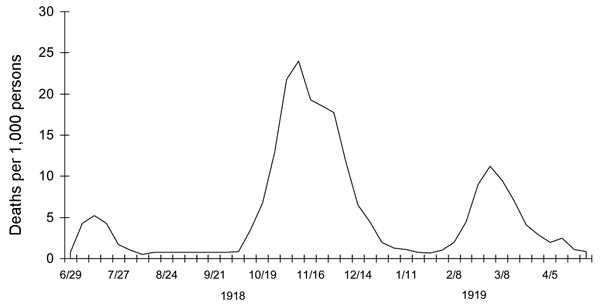
Spanish flu

It is indeed scary that The Spanish Flu had not just one but three waves. Without the internet and other modern conveniences in those days life during the pandemic must have been miserable.

How did the US equity market perform during The Pandemic of 1919? The author provided the following explanation to this question:

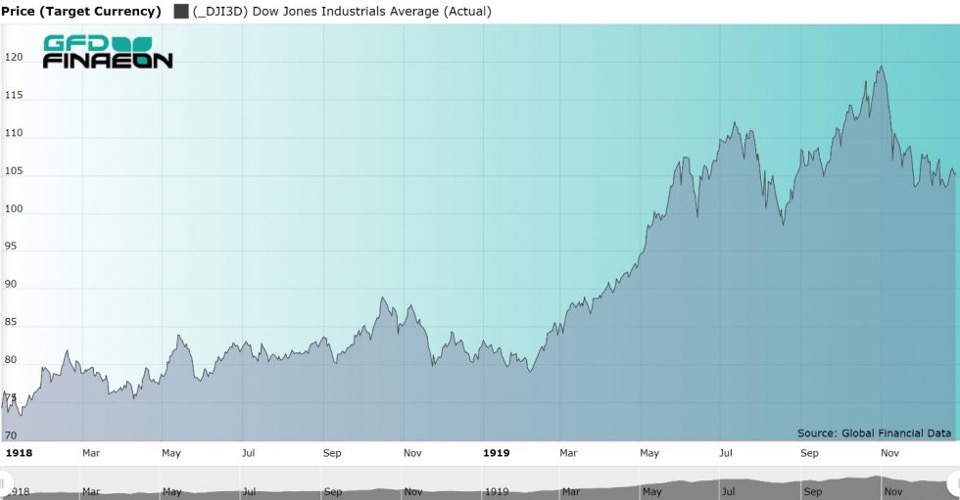
However, the impact of the Spanish Flu on the stock market was minimal. If you look at the Dow Jones Industrial Average in 1918 and 1919, you can see that the stock market was relatively unaffected by any of the three waves of the Spanish flu. Of course, the Spanish flu occurred in 1918 while World War I was raging in Europe so the war had a larger impact on the stock market than the flu.  There were few if any global supply chains that the Spanish Flu could disrupt because the war made supply chains nonexistent. The second and worst wave of flu occurred at the end of World War I when peace was finally achieved after four years of devastating destruction. It is interesting that there was little impact on the stock market of World War I ending on November 11, 1918.  Perhaps euphoria about the conclusion of the war was offset by concerns about the Spanish flu.

It is comforting to see that when the final wave of the Spanish flu subsided in February 1919, the market began an increase of 50% which lasted until November of 1919.  Whether this increase occurred because of the end of World War I or the end of the flu or both is impossible to say, but it does provide encouragement that once the coronavirus begins to subside, the market will bounce back once again. (emphasis mine)


DJIA 1918-1919

Figure 2.  Dow Jones Industrial Average, January 1918 to December 1919
 

Source: The Spanish Flu and the Stock Market: The Pandemic of 1919, Investment Office

We do not know how long it will take for the Coronavirus Covid-19 to disappear. However it is wise to learn from history and be prepared for any eventuality. Hopefully we will not have any 2nd or 3rd wave with this nasty virus as everyone has already suffered enough.

From an investment perspective, the above details about the Spanish Flu and the equity market offers us valuable lessons.
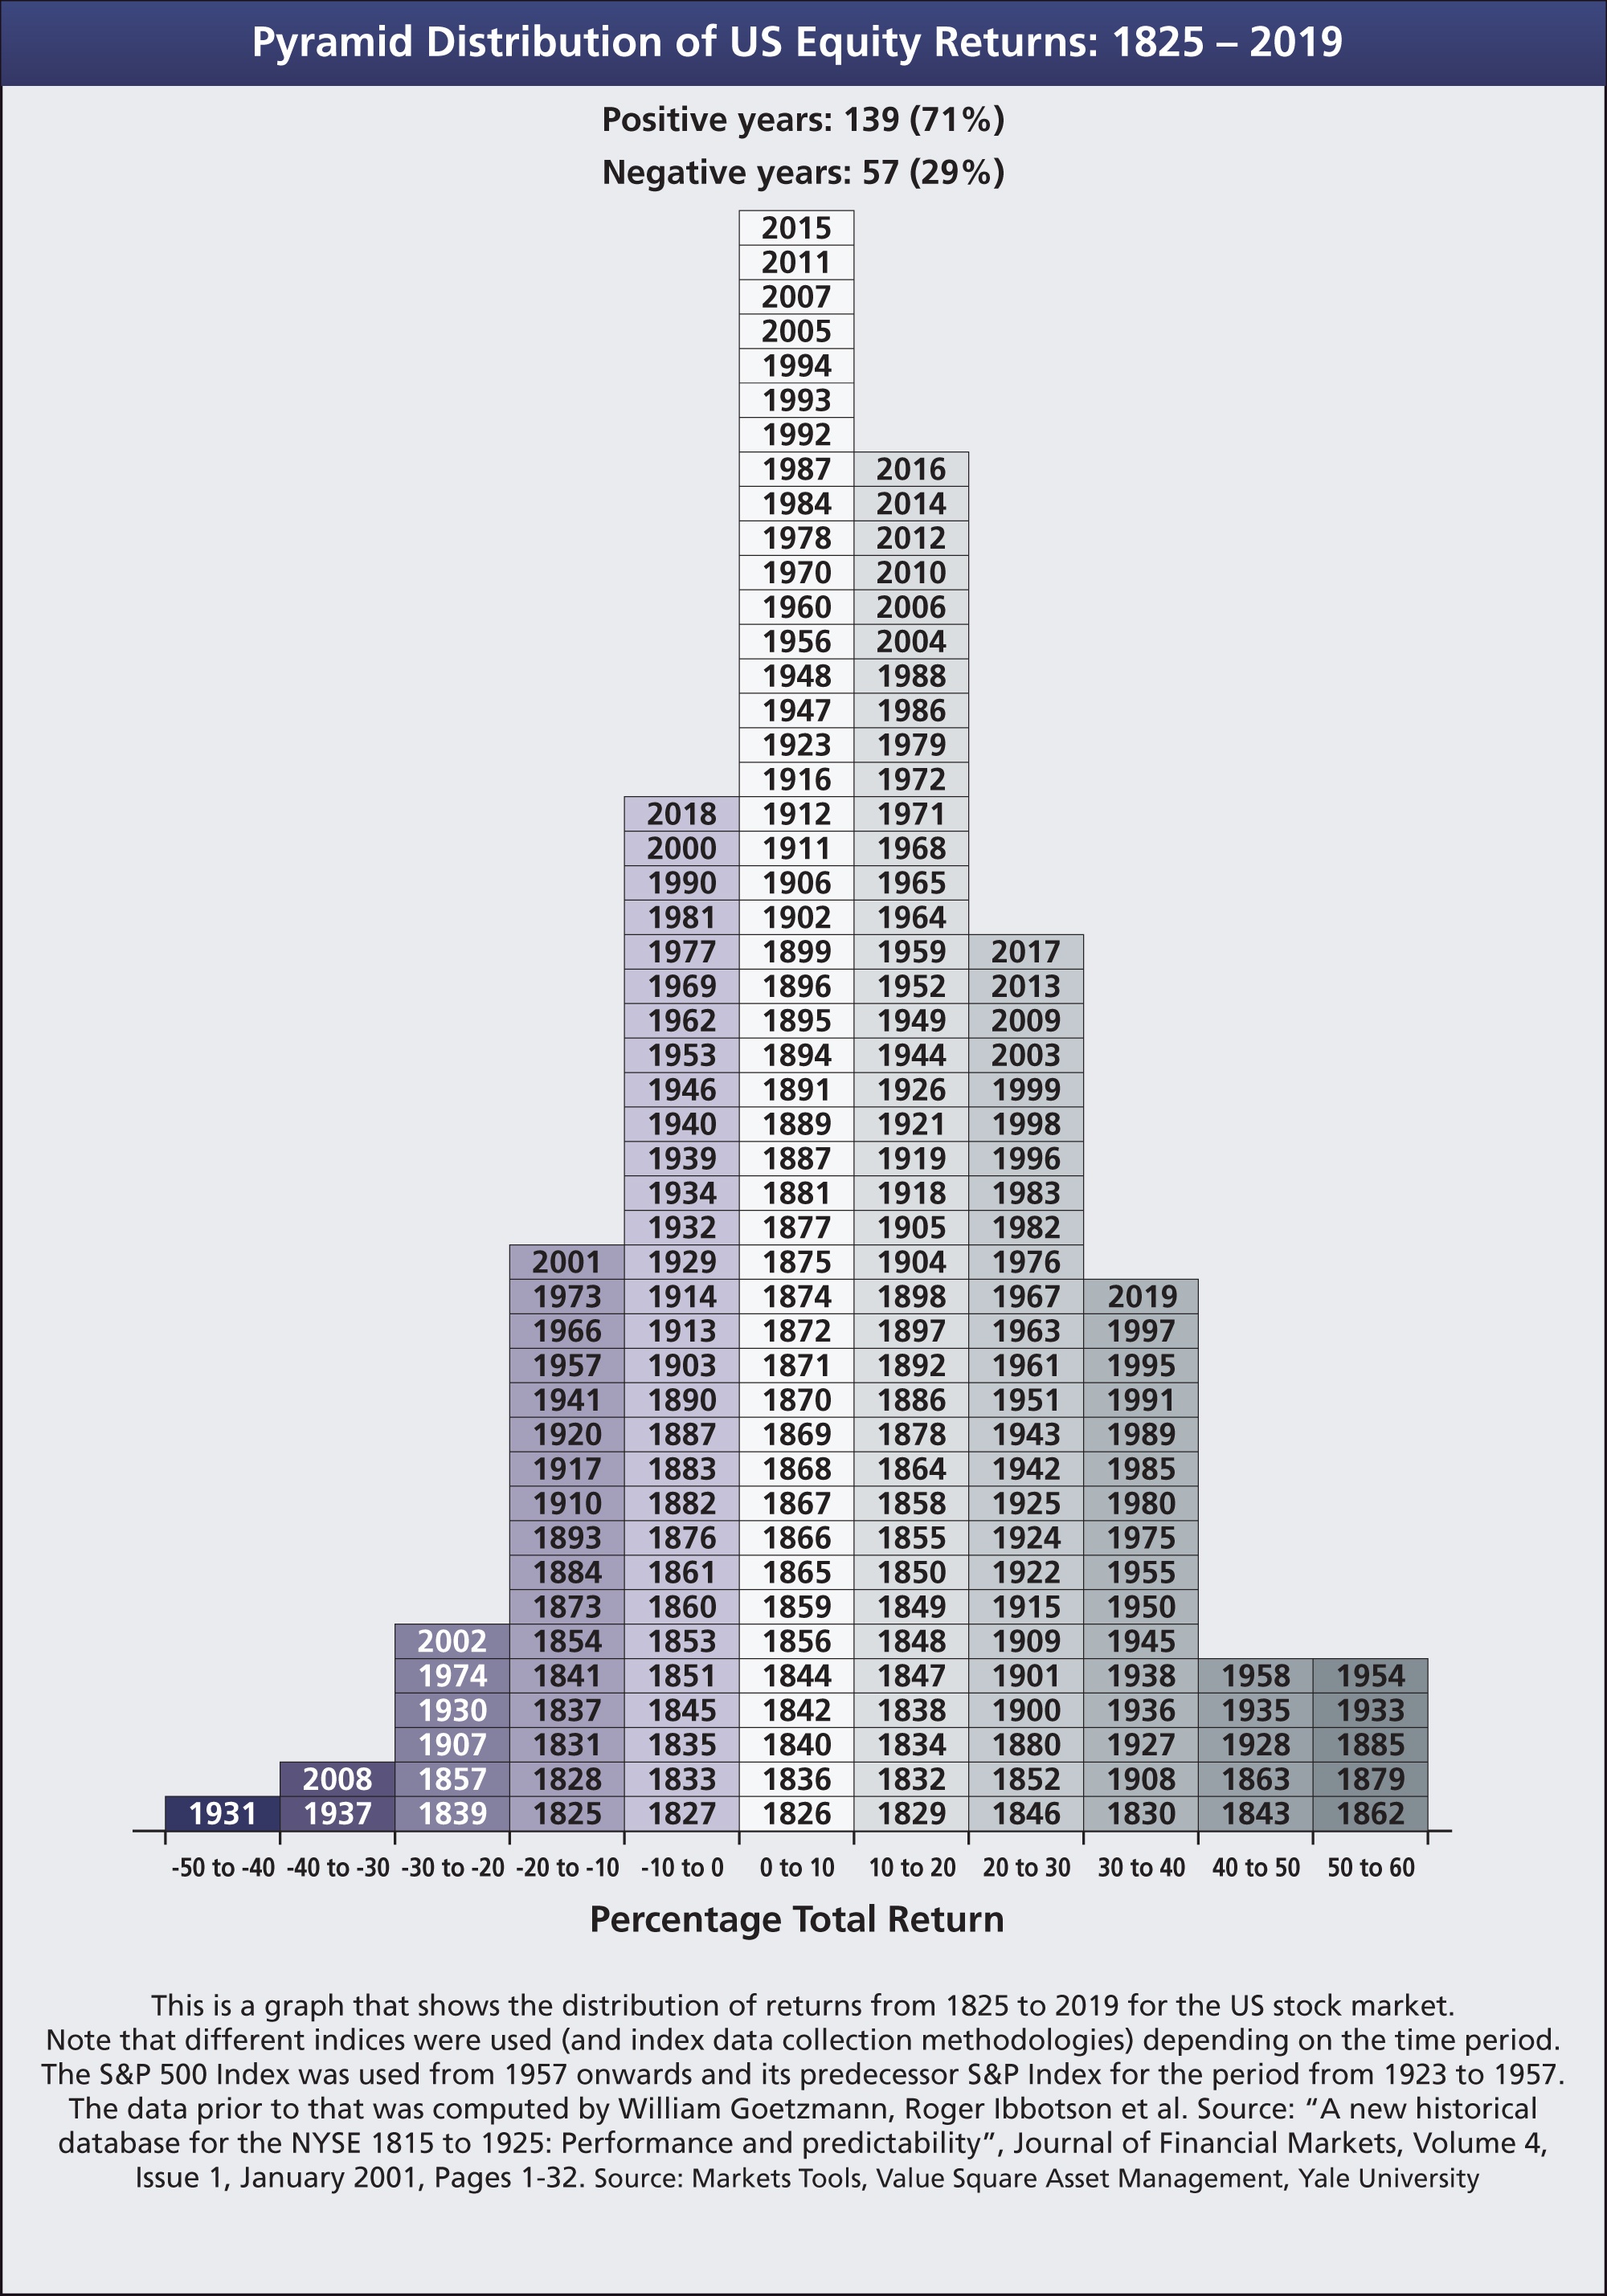
Pyramid Distribution of US Equity Returns 1825 To 2019: Chart

Equities tend to go higher in the long run. In the really long run measured in decades stocks definitely yield a positive return. US stocks have had a positive years 71% versus negative years in 29% of the time from 1825 through 2019. The annual returns shown in the below pyramid are total returns which includes dividend reinvested.

Click to enlarge

Source: Investment Office

Related ETF:

  • SPDR S&P 500 ETF (SPY)

Disclosure: No Positions

Investors Should Monitor US Bank Stocks

The US equity market recovered strongly from the lows reached in March only to start plunging again in the past few days. Fears of a second wave of Covid-19 infections and soaring death toll is taking a toll on the market. Not to mention the astonishing rise in the number of unemployed Americans that total over 36 million now. These millions of individuals are not only not working but also not consuming much as their income has suddenly evaporated. This will have a tremendous impact on banks in the country.

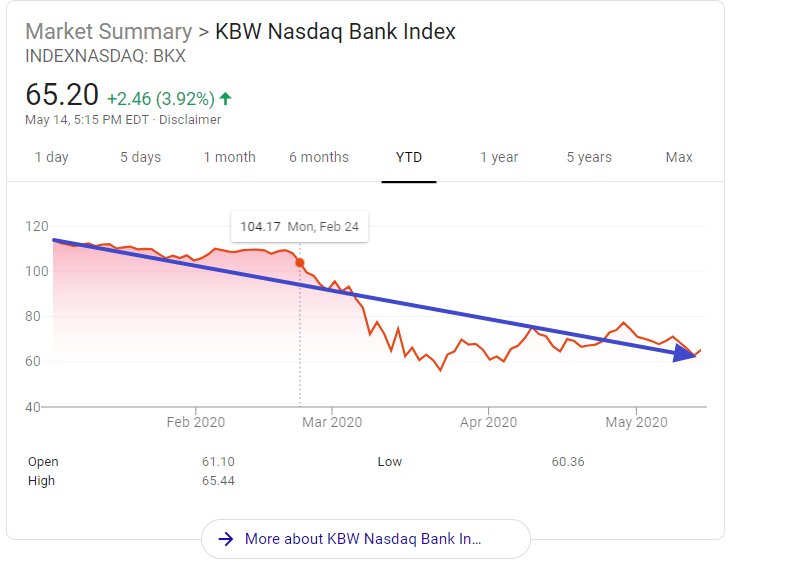
As the banking sector is considered as the pillar of the economy, it is very important to keep an eye on the performance of banks. Unemployed people are going to have trouble paying everything from car loans to credit cards to mortgages to everything in between. In addition to that, not many are going to get a new loan to buy things like a house, car, go on a nice vacation, etc. The KBW Bank Index has declined substantially year-to-date. This index represent the 24 major banking institutions in the country. As of market close yesterday the index is down just over 42%.

The KBW Bank Index Year-to-date Return:

Click to enlarge

Source: Google Finance

Most of the major banks are trading at or close to 52-week lows. For example, regional lender US Bank(USB) closed at $31.17 today which is not far from the 52-week low of $28.36.

The full list of US bank stocks trading on the NYSE can be found here. And the ones listed on the NASDAQ are here.

Declining share prices have raised the dividend yields of bank stocks. However not all banks are secure dividend plays at this time. Reduction or suspension of dividends is anticipated at least for some of the banks. Below is an excerpt on this topic from an article at Marketwatch:

Investors are looking ahead to a difficult credit cycle. The Dodd-Frank legislation in 2010 raised banks’ capital requirements and strengthened regulatory oversight. There is no talk of bank bailouts this time around.

Then again, Federal Reserve Chairman Jerome Powell said Wednesday that a survey by the central bank found that 40% of people in households earning less than $40,000 a year that were counted on payrolls in February had lost their jobs in March.

That points not only to loan forbearances and credit losses, but also to continued pain for countless businesses of all sizes that owe money to the banks.

So it is not surprising that some banks have already reduced their dividends to shore up cash.

Source:Wells Fargo leads list of bank stocks at risk for dividend cuts, Marketwatch

Should the economy get even worse and there is on improvement in the unemployment levels or COVID-19 situation, we can expect further hair cuts in the stock prices of banks. Now is not the time to jump into this volatile sector. But interested investors can keep an eye for the evolving landscape.

Disclosure: Long USB


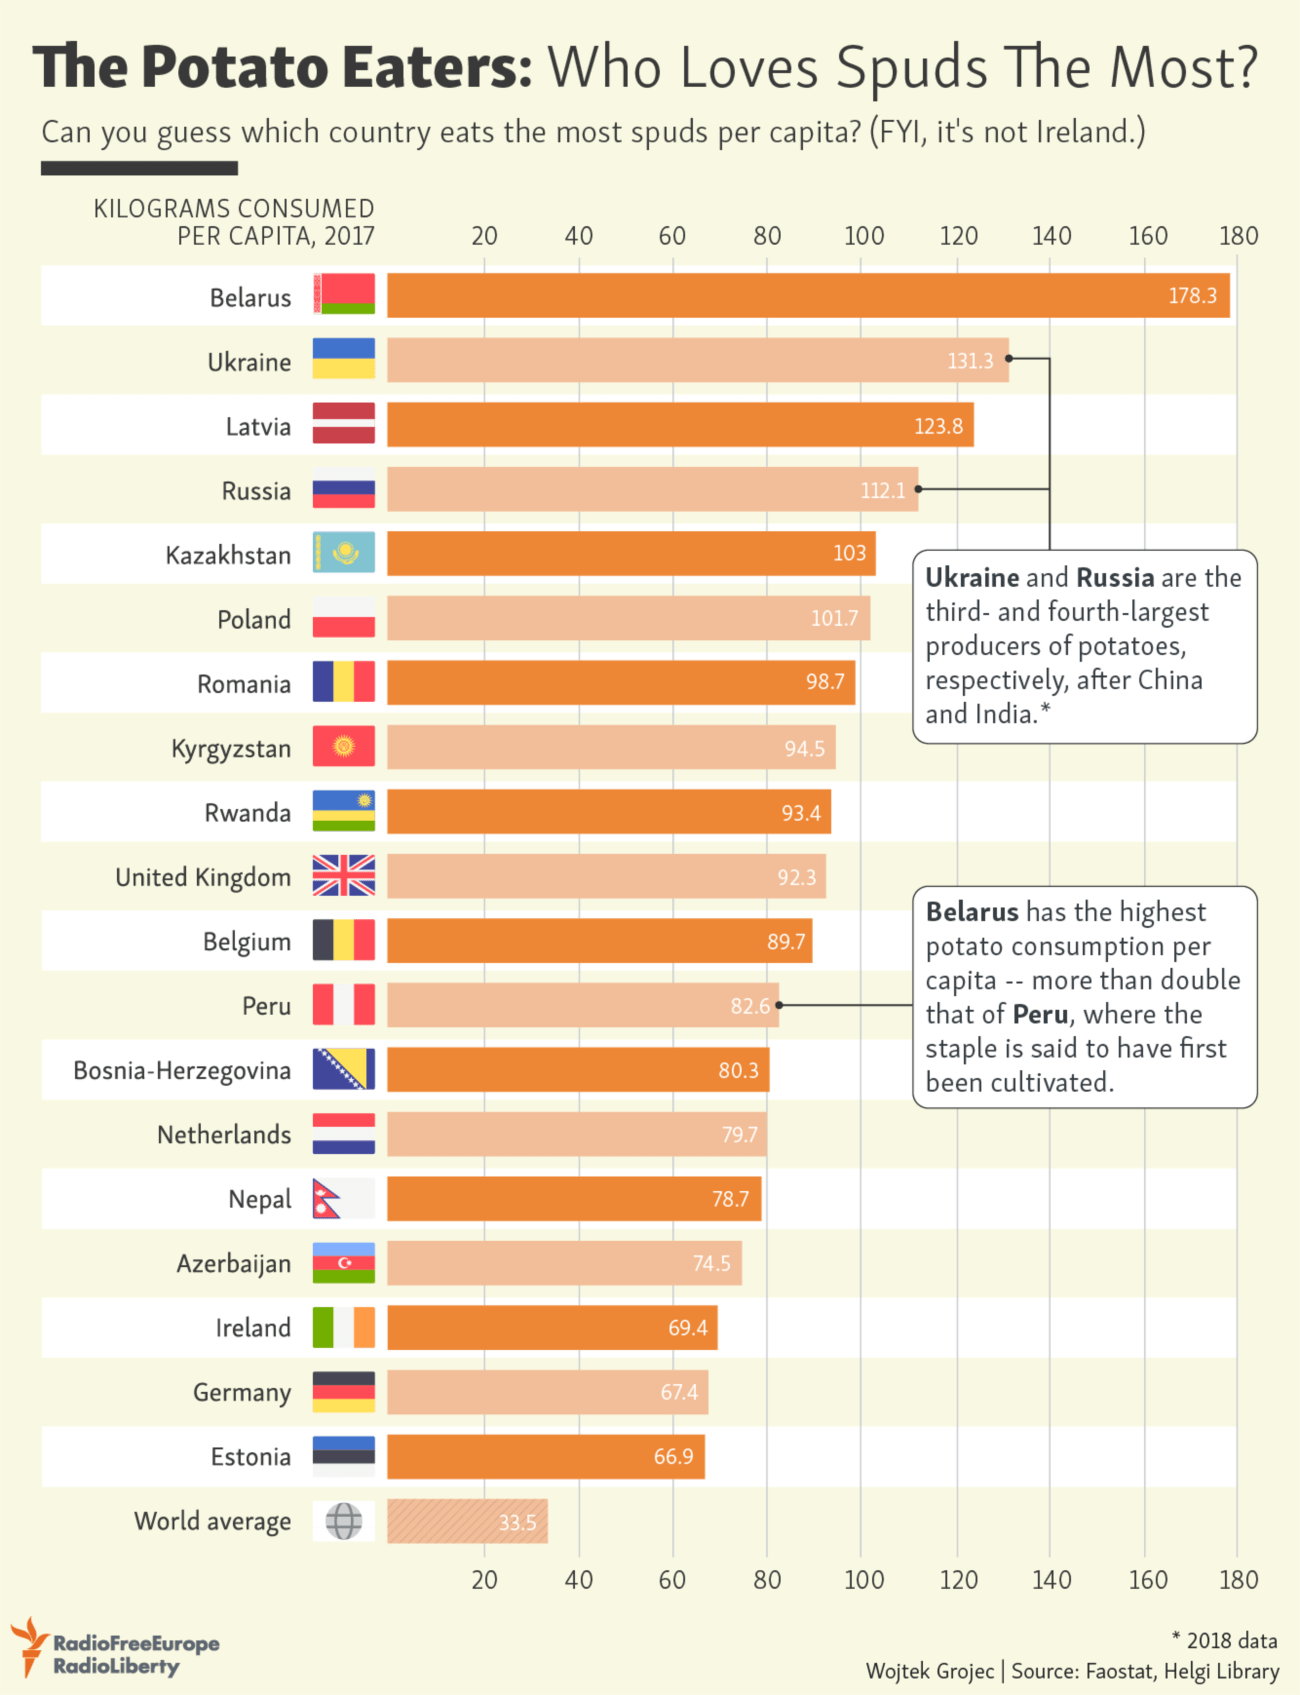
The Top Potato Eating Countries: Infographic

The top potato eating country on per capita basis in the world is Belarus. Popular wisdom may hold that it is Ireland but it is not true. The next top potato eating countries are Ukraine and Latvia followed by Russia. The US is not in the top ten countries for potato consumption.

Click to enlarge

Source: Radio Free Europe/Radio Liberty

Updates (2/11/24):

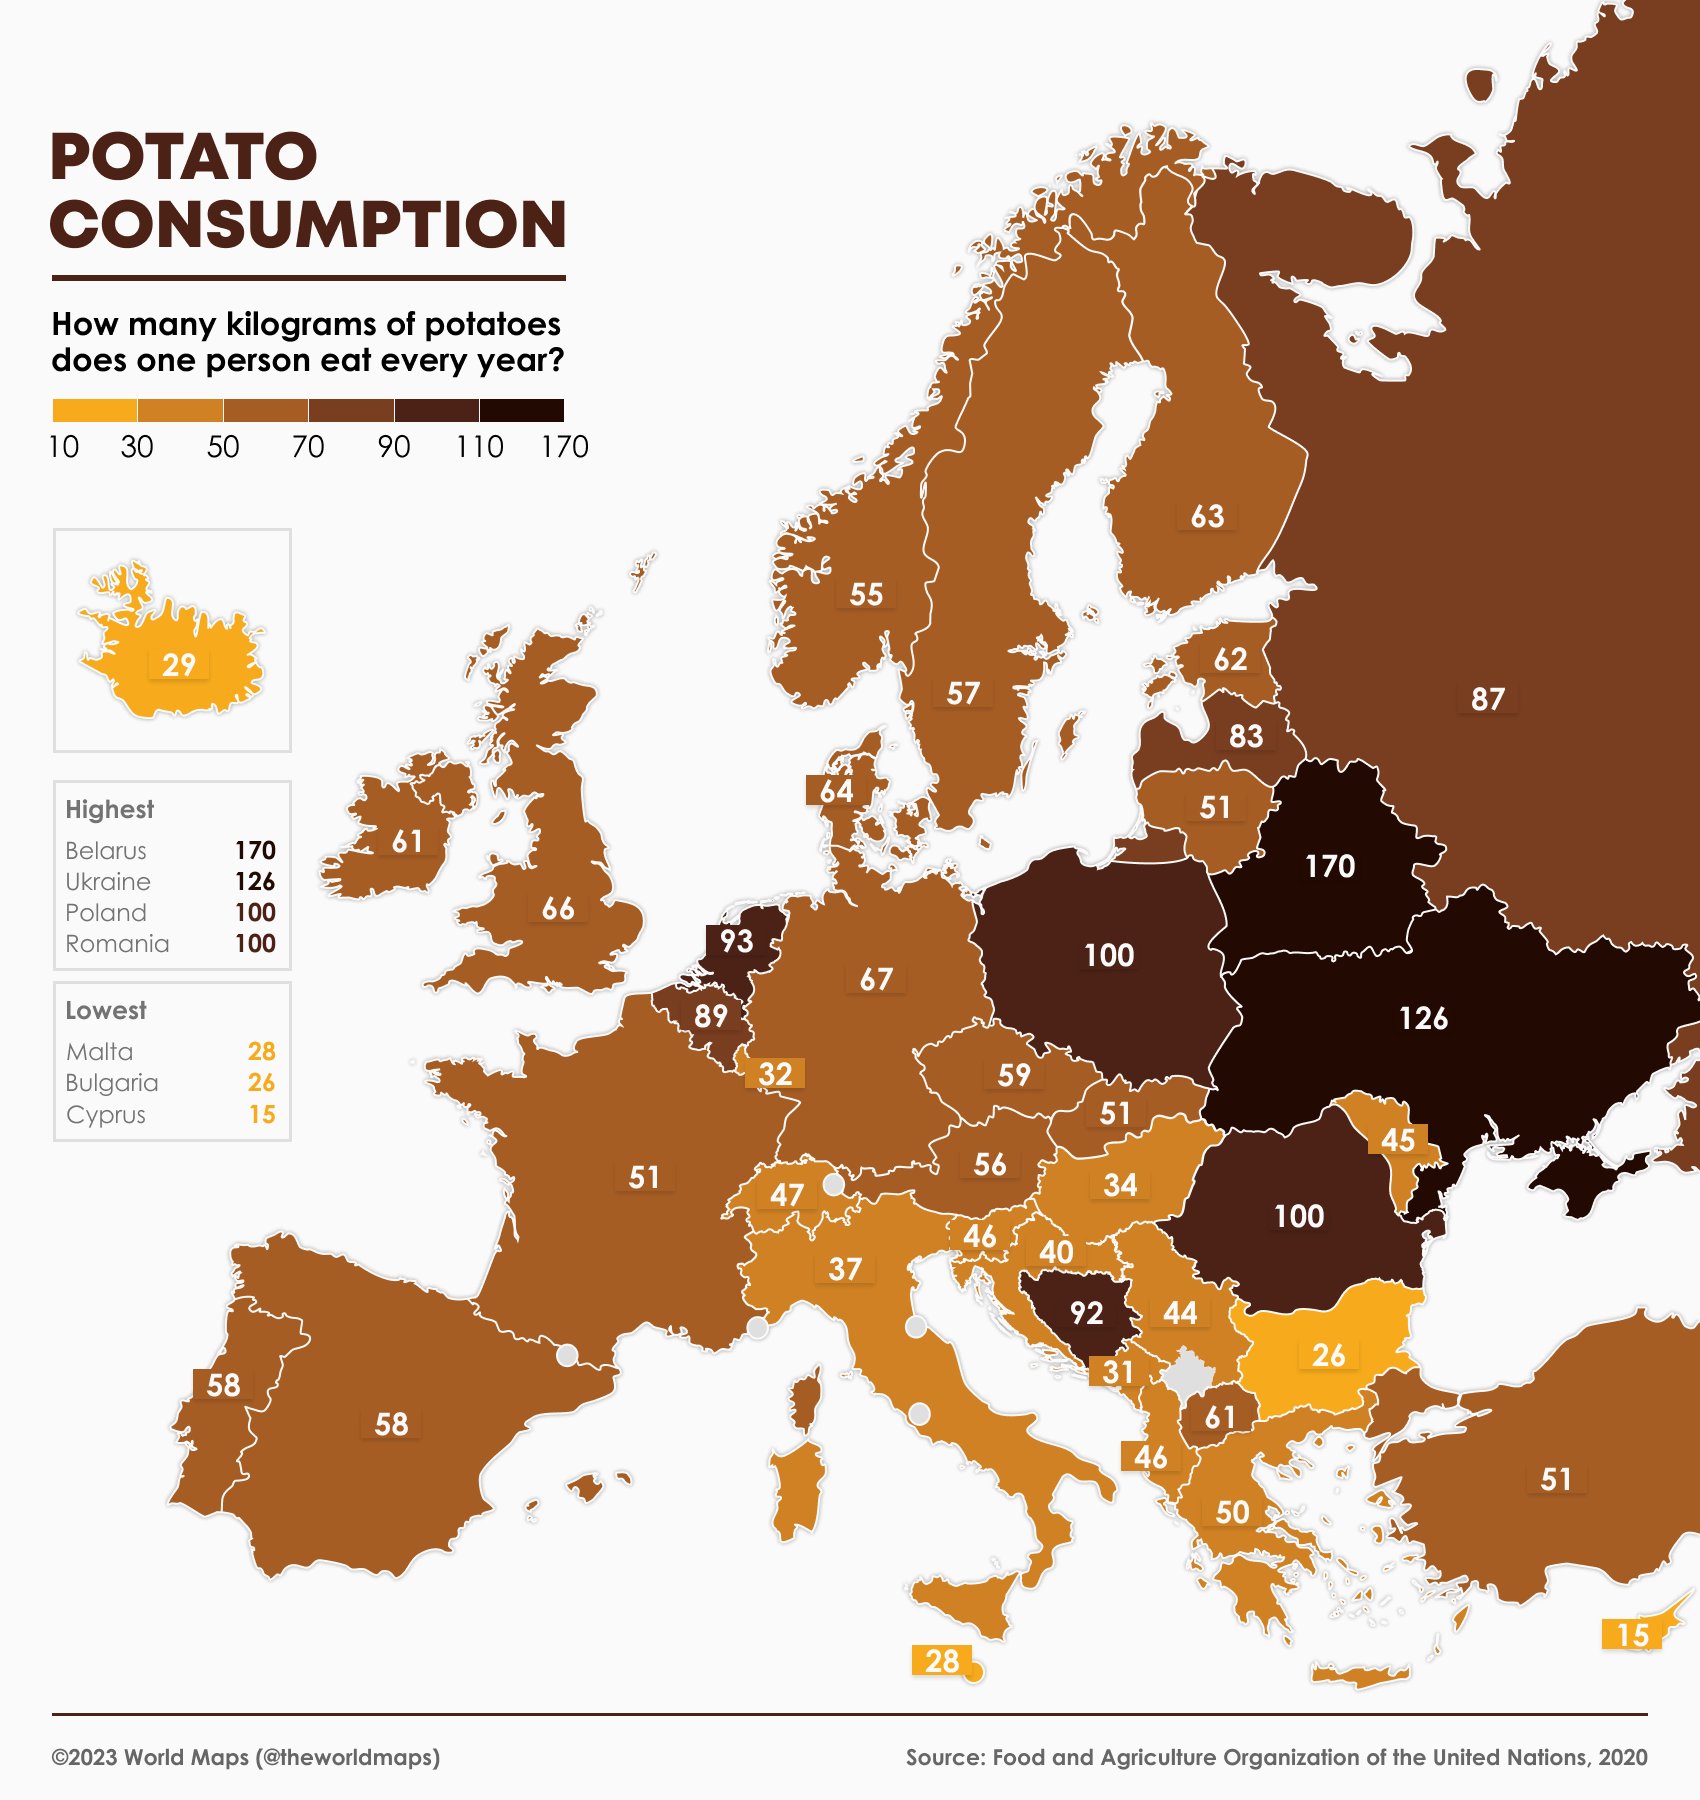
1.Potato Consumption per Country in Europe 2023:

Click to enlarge

Source: @theworldmaps via VividMaps

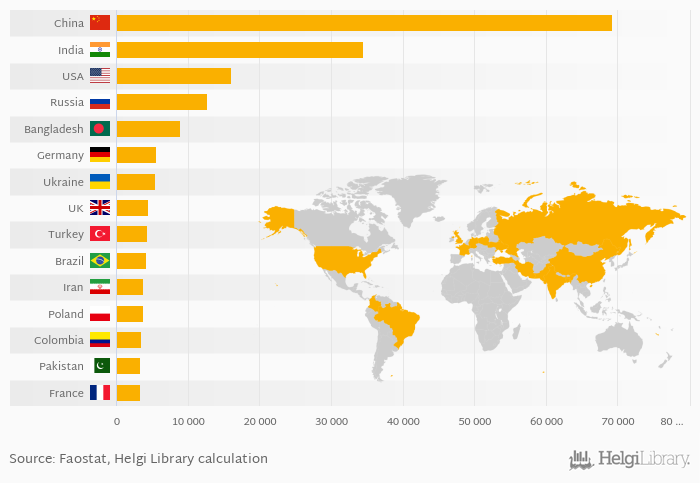
2.Which Country Eats the Most Potatoes?:

Source: Which Country Eats the Most Potatoes?, HelgiLibrary

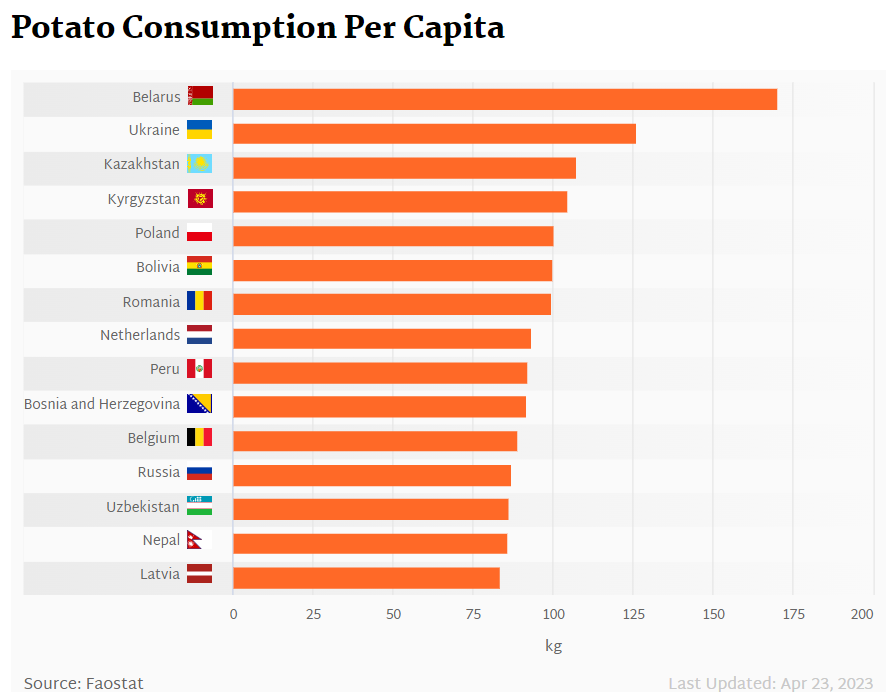
3.Potato Consumption Per Capita  2023:

Source: Potato Consumption Per Capita, HelgiLibrary

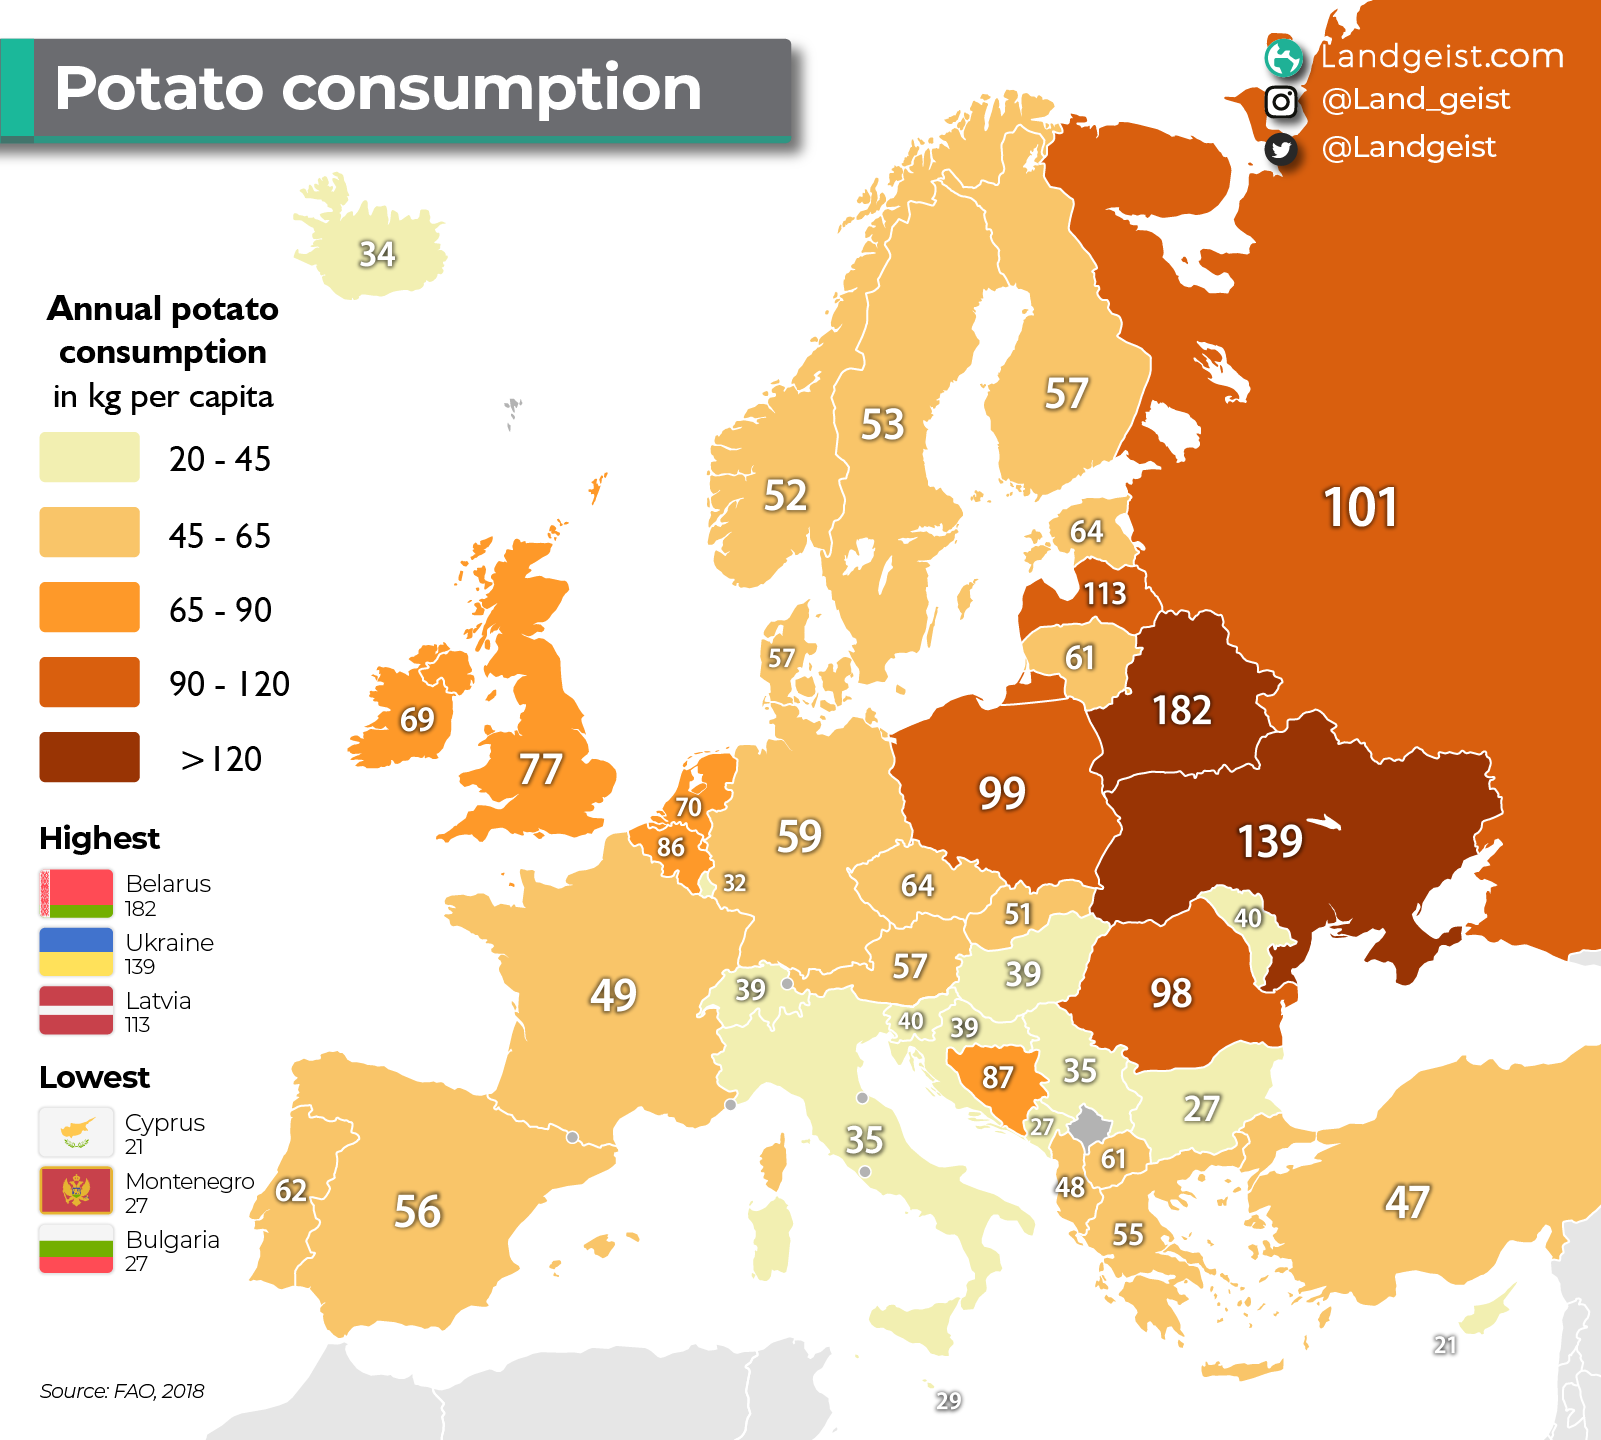
4.Potato Consumption in Europe:

Source: Potato Consumption in Europe,   Landgeist

You may also like:

Dow Jones Index During Depression And After: Chart

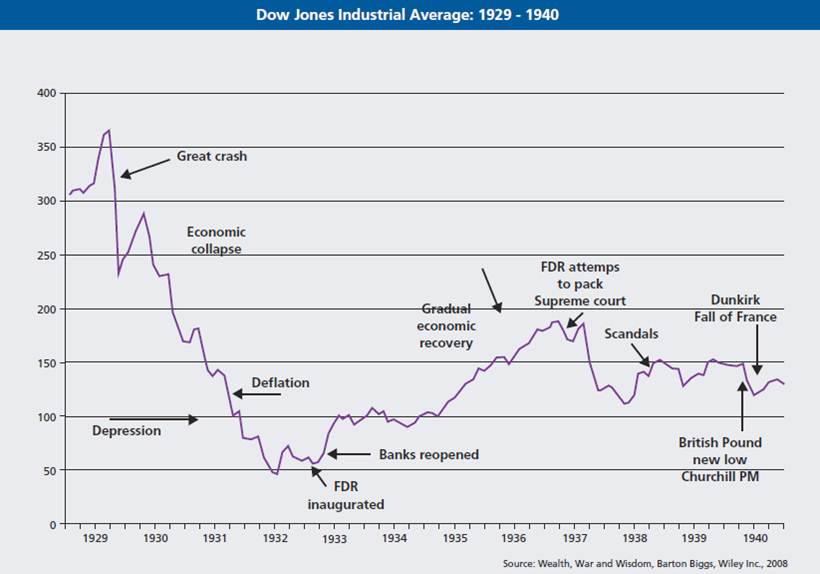
The US equity market plunged dramatically in 1929 triggering the Depression. From the peak of 1929 to the bottom reached in 1932, millions were unemployed and untold misery was brought upon the general population.After FDR was inaugurated as the 32nd President of the United States the economy slowly started to recover.

The chart below shows the returns of the Dow Jones Index from 1929 through 1940:

Click to enlarge

Source: Stock Markets during the second World War, Investment Office