Not All The Best Stocks Are In The U.S.

One of the myth that is common among investors is that ALL the best stocks in the world are in the U.S. Nothing could be further from the truth. While it is correct that overall US stocks have performed very well in the past few years outperforming their foreign peers this does not mean the best performing stocks are only in the US. In fact, some of the top performing stocks at a global level can be found outside of this country.

The reason why many best performing stocks are abroad is because the total number of stocks in the world excluding the US is a lot higher than the domestic companies currently trading in the US market. So with a larger universe the opportunities to find top stocks is higher.It should be noted that the country is home some of the fastest growing, top performing and world-class companies such as Netflix(NFLX), Amazon(AMZN), etc. However many of these giants are highly valued or in some ways overvalued leading to a rich valuation for the overall market vs. other developed markets.

According to an article at the Capital Group, 75% of the top stocks since 2011 have been outside the U.S. From the article:

In fact, looking at it on a company-by-company basis, it’s the opposite: The stocks with the best annual returns have been overwhelmingly located in non-U.S. markets.

That company-by-company trend is even more pronounced in the year-to-date period through May 31. The list of investable companies with the best year-to-date returns is dominated by Chinese firms. That’s not surprising, given China was the first country to get hit by the COVID-19 outbreak and among the first to emerge from lockdown.

While the YTD period is a very short time frame, the trend has generally played out over longer periods as well. Why? It’s all about opportunity set. There are roughly three times as many foreign stocks as domestic. So why fish in a smaller pond when there are great companies all over the world? It’s important to have the flexibility to choose among the best companies, no matter where they are located.
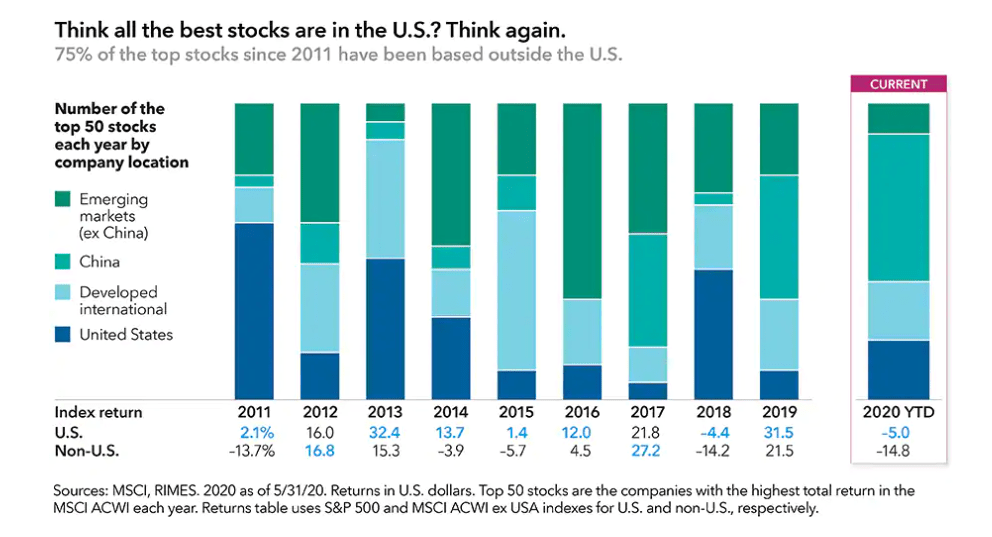
Source: Midyear Outlook: International markets on the comeback trail, Capital Group

There plenty of other interesting and informative facts in the article. So you may want to check it out.

Disclosure: No Positions
Apple is Worth More Than The Australian Stock Market

The current market capitalization of Apple(AAPL) is $1.53 Trillion in US Dollars. This is equivalent to approximately $2.16 Trillion Australian Dollars.

The entire market capitalization of the Australian domestic market capitalization is ~A$1.9 Trillion.

Source: Market Index

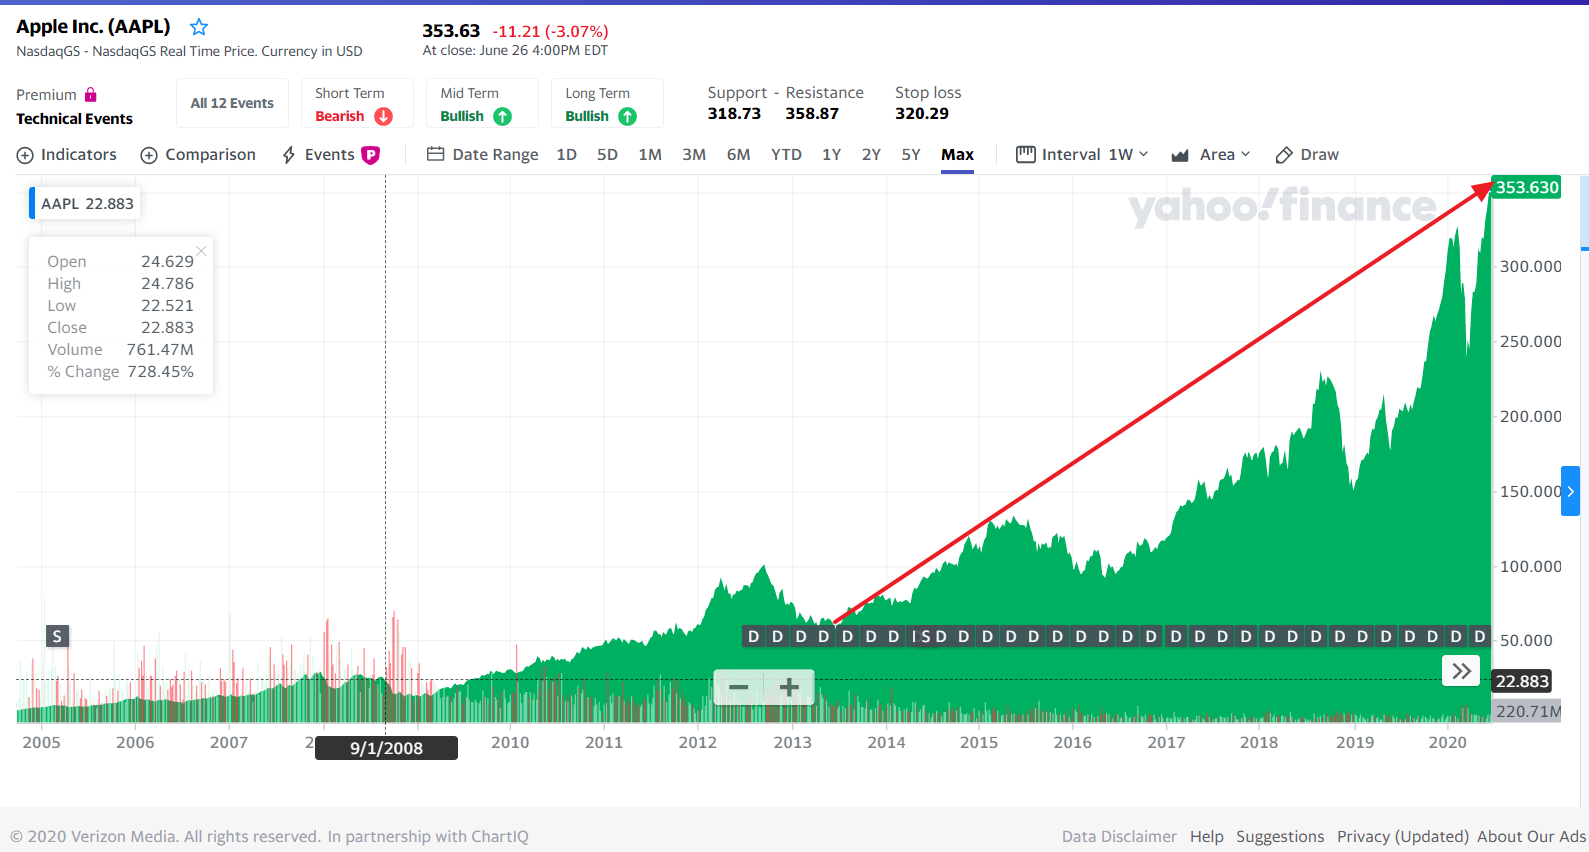
The below chart shows the long-term growth of Apple(AAPL):

Click to enlarge

Source: Yahoo Finance

Disclosure: No Positions

Hunting for Dividend Stocks in Europe? Watch out for Concentration Risk

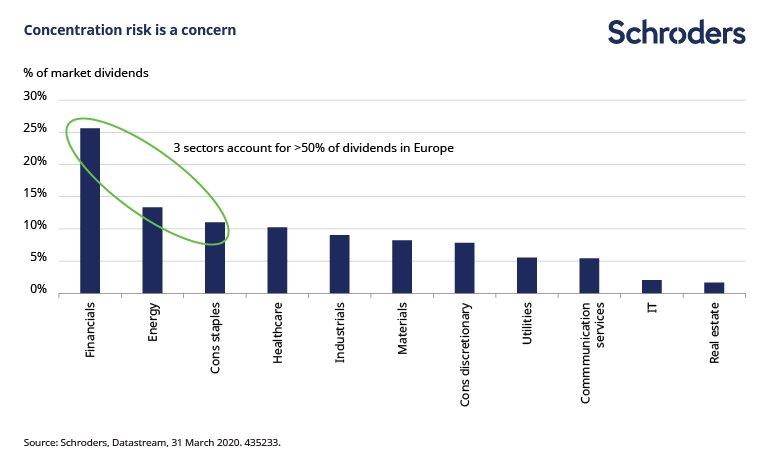
Europe is a fertile ground for income seeking investors. Relative to US firms. European firms generally tend to have higher dividend payouts. However when picking European dividend stocks it is important to be aware of the concentration risk as more than 50% of the total dividends is paid out firms in just 3 sectors. These sectors are Financials, Energy and Consumer Staples as shown in the chart below:

Click to Enlarge

Source: Yield hunting in an uncertain world, Schroders

As the Coronavirus started ravaging Europe back in March major European banks suspended their final dividend payments for 2019 and the interim dividend for this year. Similarly in the energy world, Royal Dutch Shell (RDS-A, RDS-B) cut its dividend payment for the first time since World War II. This shows the risk that even seemingly great companies can take extreme measures to preserve cash. European banks have struggled for years since the Great Financial Crisis (GFC) to regain their former glory but until so far have failed to do so. The current pandemic added some more salt to these already wounded banks.

The key takeaway is that diversification is the easiest way to reduce concentration risk. So when building a portfolio of dividend stocks its important to spread out the assets among various sectors, companies, countries and regions.

Disclosure: No Positions

Sector Concentration Risk is High in US Equity Markets

The US equity markets as represented by the S&P 500 has performed very well so far this year despite the dramatic selloff in late first quarter. The S&P 500 is down just 3.09% year-to-date on price return basis. However the market has become more highly concentrated with a handful of firms doing the heavy lifting. So much so that it seems like the S&P 500 might as well be called as the S&P 5 to highlight the importance of the 5 companies. Of course, we are talking about the FAANG group of current market darlings. The FAANG represents Facebook(FB), Amazon(AMZN), Apple(AAPL), Netflix (NFLX) and Google or its parent Alphabet (GOOG).

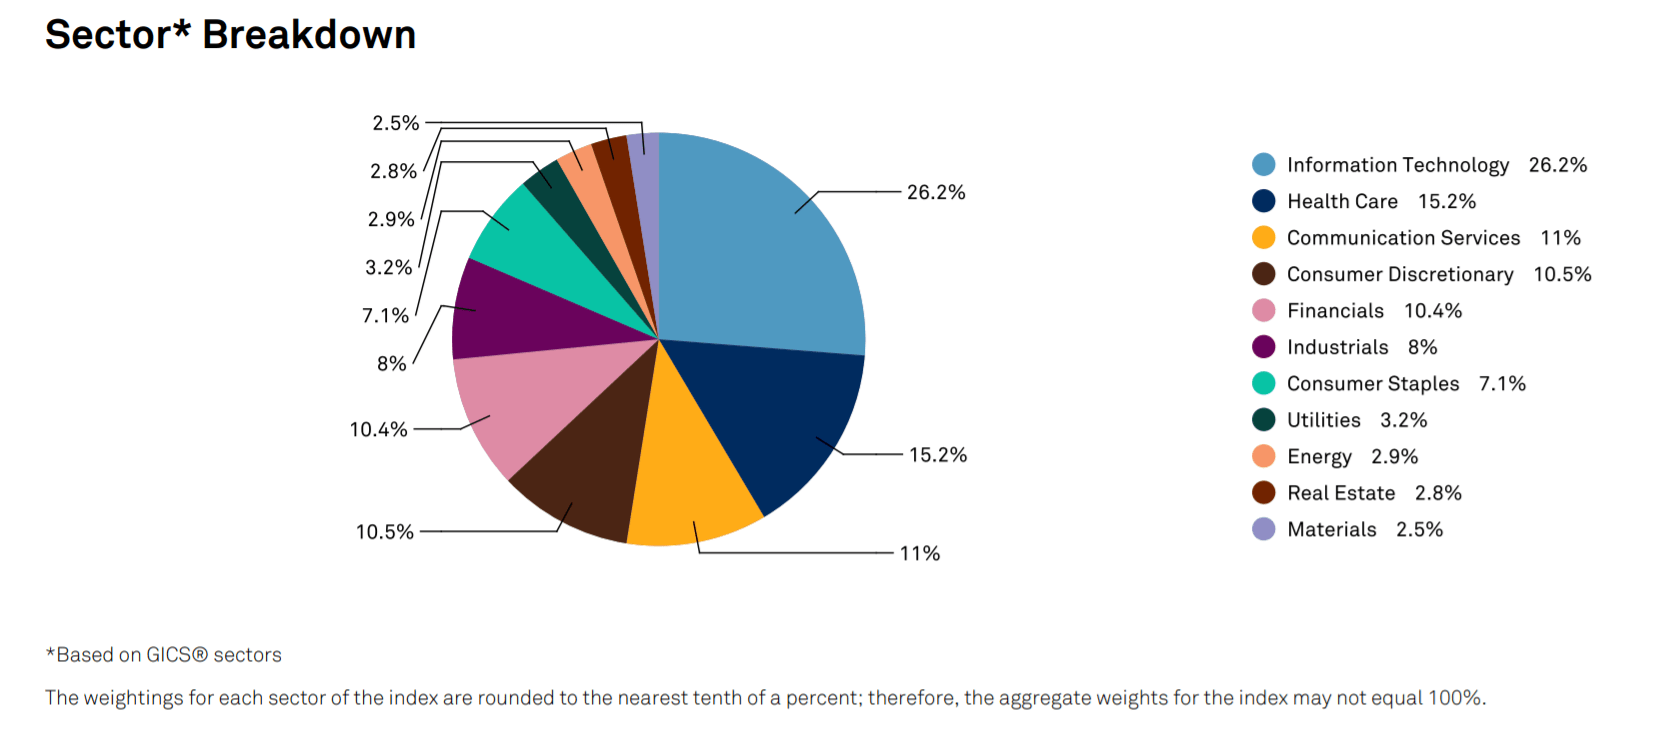
At the end of 2019, Information Technology and Communication Services sectors accounted for 33.6% of the index. By May end of this year, the weightage for these sectors jumped to 37.2% as shown in the chart below. Amazon is part of the Consumer Discretionary sector. When some of that sector’s weight is added the overall concentration goes even higher. Moreover Amazon has shot up by about 50% year-to-date while Netflix has gone up by over 44%.

Click to enlarge

Note: The above chart is based on data as of May 31, 2020

Source: S&P Indices

Once sector concentration reaches too high, selloffs can occur in the following year according to a January article by John Petrides at  Tocqueville Asset Management. To illustrate the argument, he gave examples of the past meltdowns in the energy, dot com and financial sectors.

From the article titled The S&P “5”:

Sector Concentration Risk

At the end of the year, the Technology and Communication Services sectors (which holds the likes of Alphabet and Facebook), combined were 33.6% of the S&P 500. If you add in Amazon, which is categorized as a Consumer Discretionary stock, the concentration is closer to 36%. Sector concentration is not unusual for the Index, but we have seen this story play out before. In 1999 the Tech and Telecom sectors combined were near 40%; Financials in 2007 were at 22%; and Energy in 2008 was at 16%. Once these sectors reached these peaks, the following years were met with a precipitous sell off: the blow-up of the dotcom bubble in 2000, the collapse of Bear Stearns beginning in 2007, and the emergence of U.S. shale to squash the “peak oil” debate. The current sector concentration is not a forecast of impending doom, but rather a wake-up call for investors to be aware of the potential risk being taken by simply “owning the market.”

Note: The above chart shows data through the end of 2019

Source: The S&P “5”,  Tocqueville Asset Management

Key Takeaway:

Caution is warranted when the concentration of one or more sectors becomes too high in the index. Accordingly it is important to diversify across different firms in many sectors. In addition, “buying the market” by simply picking up an ETF or an index fund is also risky as they track the S&P 500.

Related ETF:

  • SPDR S&P 500 ETF (SPY)

Disclosure: No Positions

On the Sources of Electricity in Germany 2020: Chart

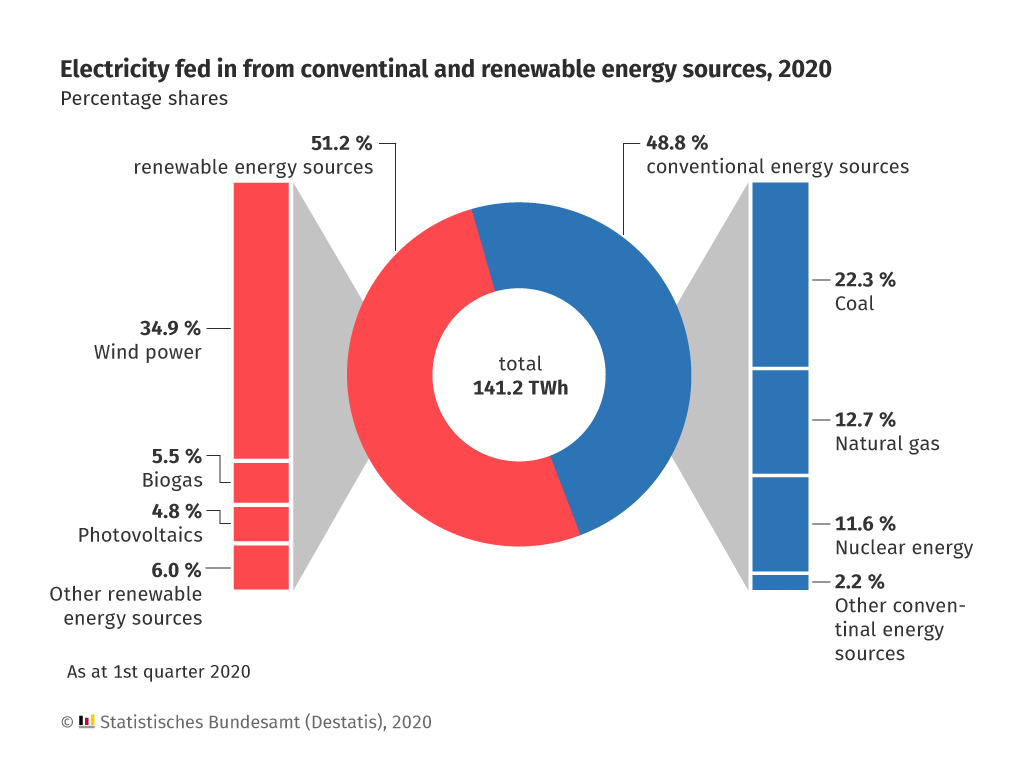
Germany generated more than 50% of its electricity from renewal energy sources in the first quarter of 2020 according to Destatis. Windpower accounted for the majority of the renewal energy produced.  Solar amounted to about 5% of the renewable energy sources. In the conventional energy source, coal is still the king accounting for 22% followed by natural gas. Unlike in neighboring France, the nuclear energy is relatively low at just 11% of the conventional energy sources in the country.

Click to enlarge

Source: Destatis

Related Stocks:

Disclosure: Long both stocks