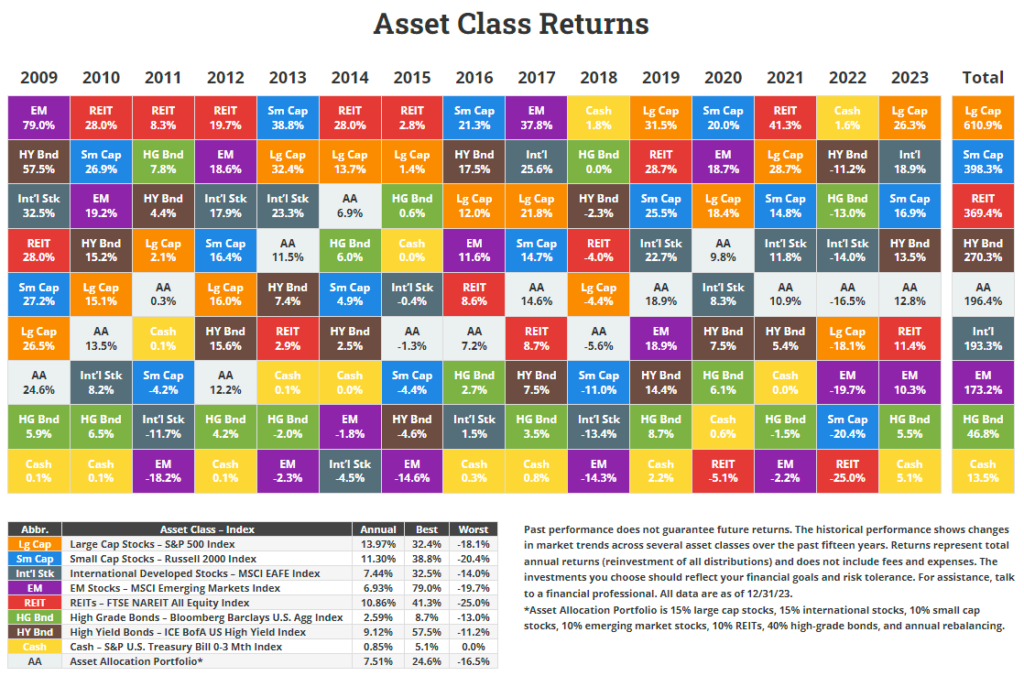
Asset Class Returns From 2009 To 2023: Chart

We looked at the emerging markets returns and S&P 500 sector returns chart for 2023 in two posts earlier. In the post below let’s take a quick look at the asset class returns chart from 2009 to 2023 that was also published by Novel Investor. As expected, large caps were the winners in 2023 followed by international developed stocks. Cash was the worst performer with a return of 5.15% followed by high-yield bonds.

Over the past 15 years, large caps as denoted by the S&P 500 crushed all other assets with a return of over 610%. International developed stocks lagged by a substantial margin with a return of just 193%.

Click to enlarge
Source: Novel Investor
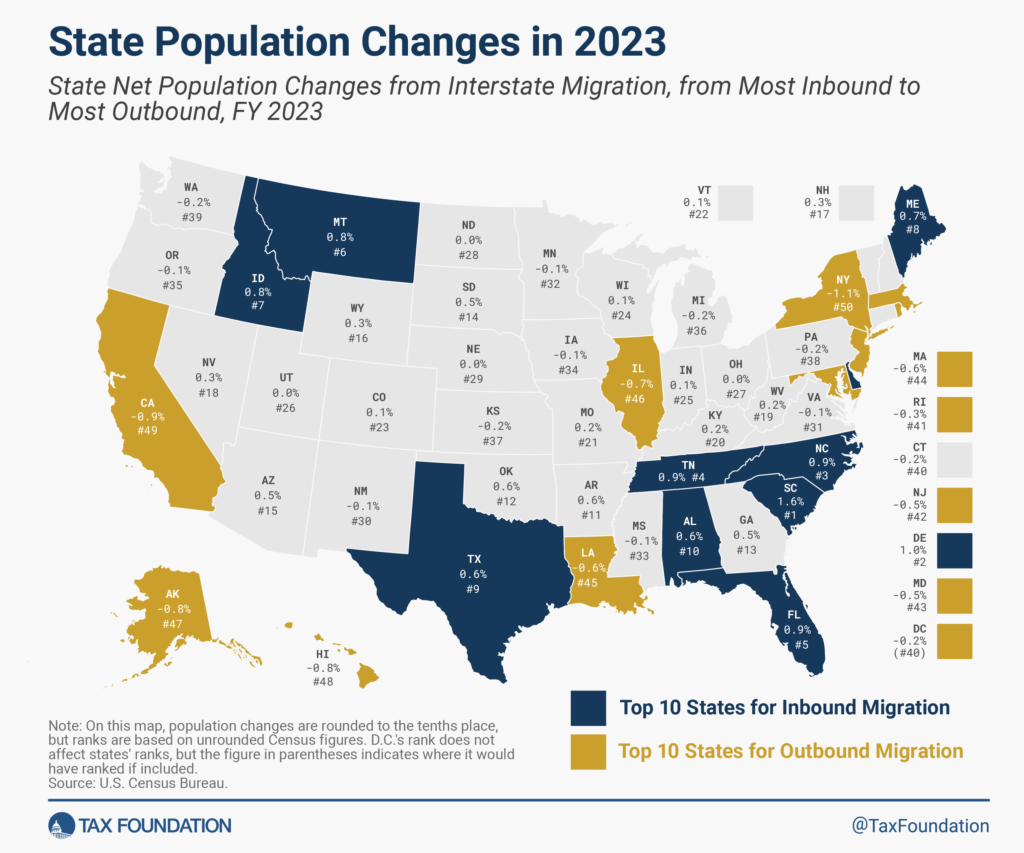
The Top 10 States for Inbound and Outbound Migration in the US 2023: Chart

Migration within states in the US increased during the Covid-19 pandemic era when people in big cities moved out to smaller cities and rural areas. The popularity of remote work after the pandemic also is a driving factor for population migration. A recent report by the Tax Foundation noted that more people migrated from high-tax states to low-tax states. The top five states the lost the most population in 2023 were New York, California, Hawaii, Alaska and Illinois in that order. The top five states that had the highest population growth due to inbound migration are all low-tax states – South Carolina, Delaware, North Carolina, Tennessee and Florida respectively. Texas is also a big winner of inbound migration from high-tax states like California for example.

Click to enlarge

Source: Americans Moved to Low-Tax States in 2023, Tax Foundation

The entire report is worth a read.

You may also want to read the below post by Mish published last month:

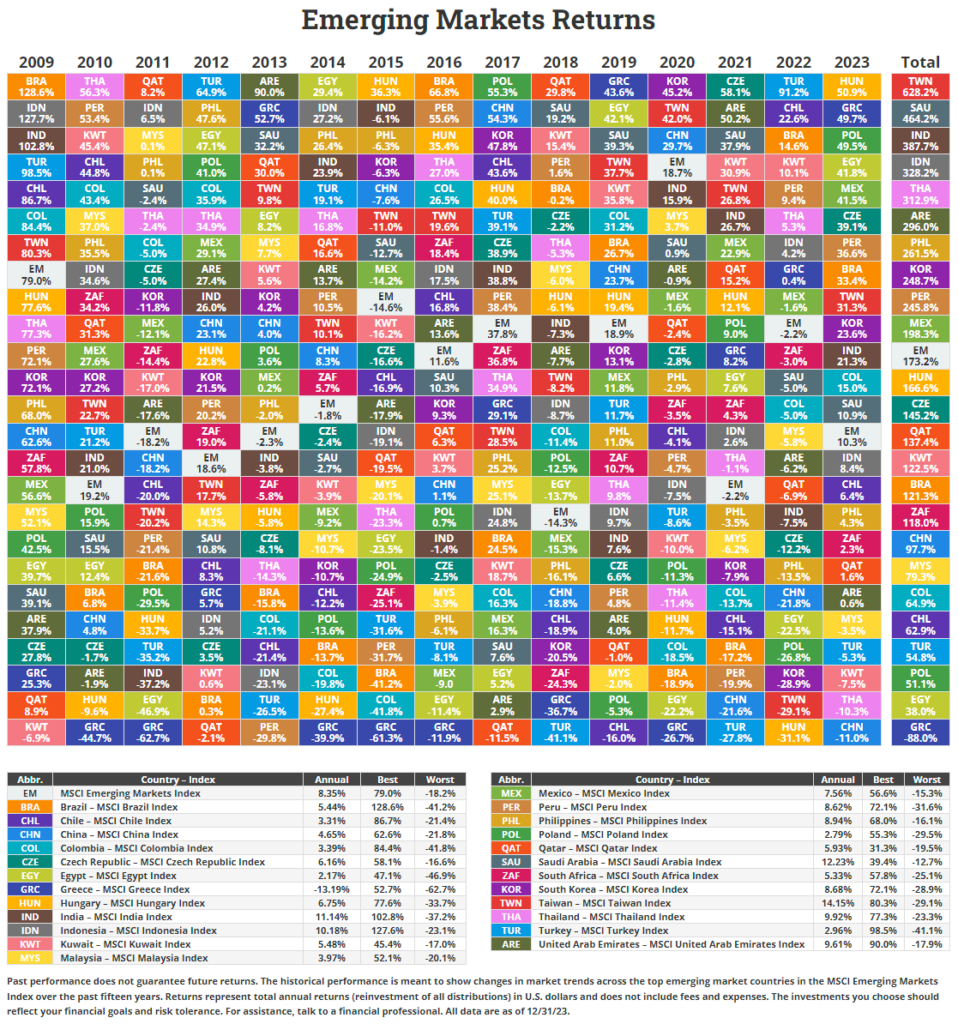
Emerging Markets Returns by Country 2009 to 2023: Chart

We reviewed the S&P 500 sector performance chart for 2023 in an earlier post. The following chart shows the emerging markets returns by country from 2009 to 2023 also published by Novel Investor. Last year Hungary was the best performing emerging market followed by Greece and Poland. Who would have thought that Greece, which was in the midst of a sovereign debt crisis a few years ago, would be one the top performing markets in 2023. Mexico also had an excellent return at over 41%.

The worst performing market last year was China.

Click to enlarge

Source: Novel Investor
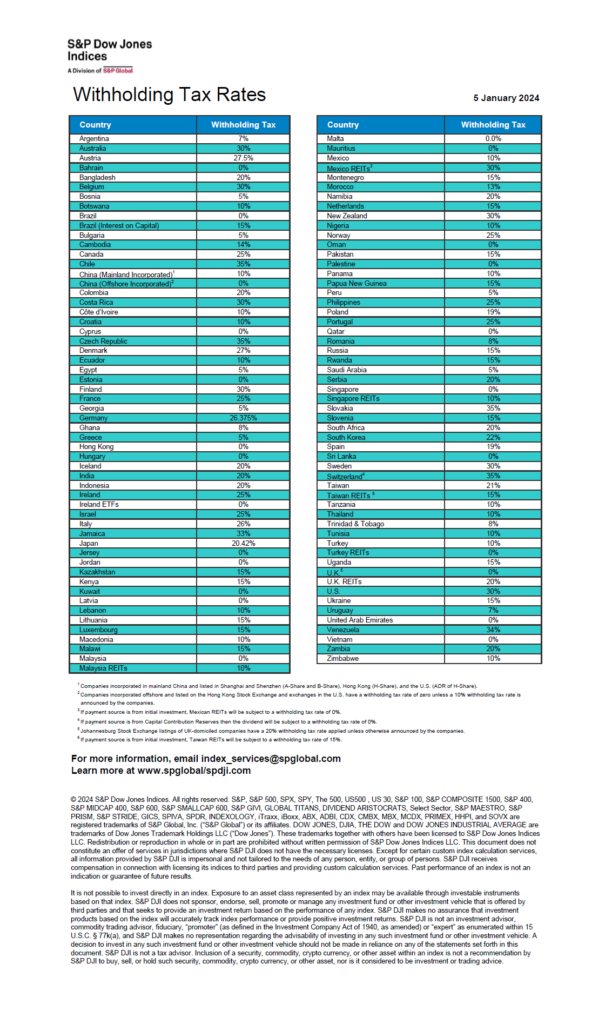
Dividend Withholding Tax Rates by Country for 2024

S&P Global has published the Dividend Withholding Tax Rates by Country table for 2024. This handy one-pager is a useful tool for investors that invest in foreign stocks. Dividends from most foreign stocks are subject to withholding taxes for Americans and hence it is important to keep track of the rates. Higher tax rates would reduce the overall net dividend yield.

From my post last year:

Though the rate for Canada is noted as 25% in this table, this can be reduced to 15% in non-retirement accounts by submitting NR-301 form to Canada Revenue Agency (CRA). For stocks (excluding REITs) held in qualified retirement accounts such as IRAs, Canada does not withhold any dividends for US residents. So Canadian income equities are ideal for US retirement accounts.”

Click to enlarge

Source: S&P Global

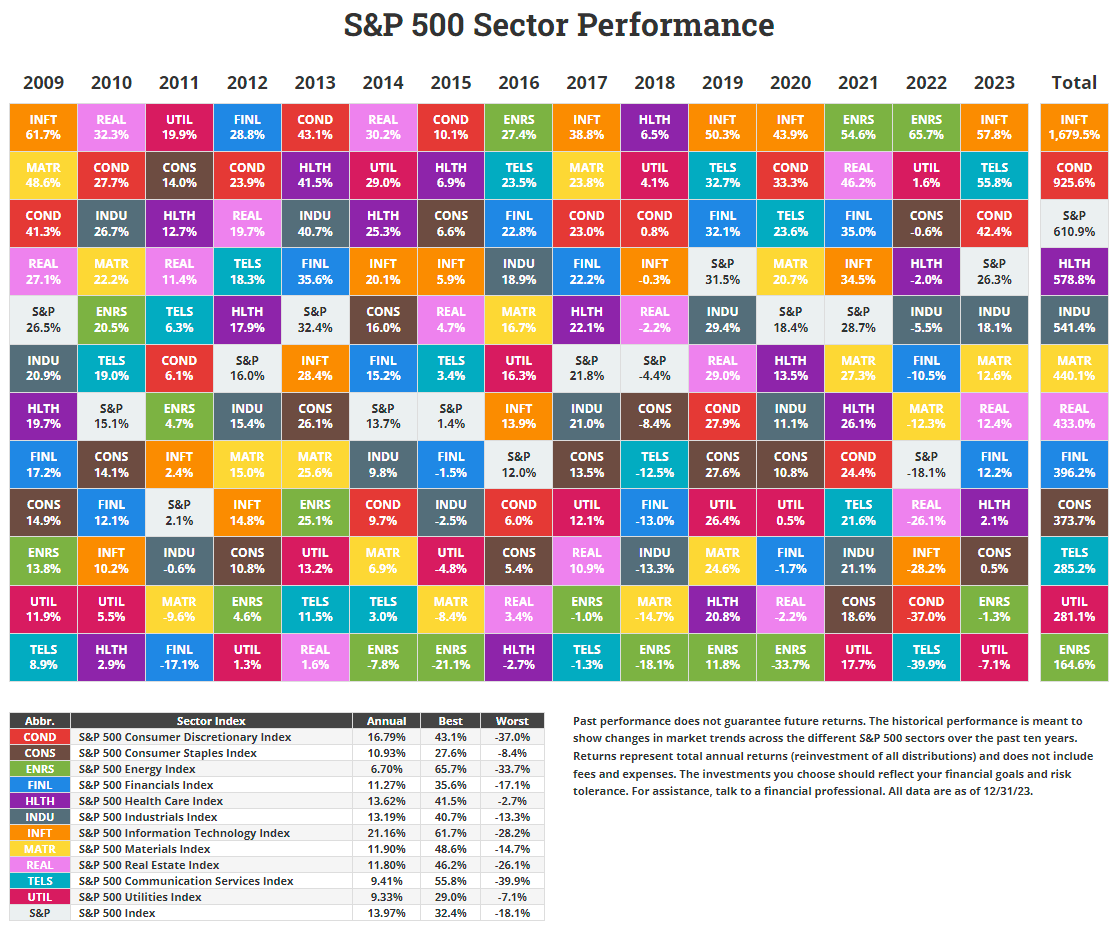
S&P 500 Sector Performance by Year from 2009 to 2023: Chart

The latest edition of the annual S&P sector performance chart for the S&P 500 was published by Novel Investor this week. In 2023, the best performing sector was the tech sector as represented by INFT, the S&P 500 Information Sector Index. The sector annual return’s was over as astonishing 57%. The next top performers were communication services and consumer discretionary index. The strong returns of consumer discretionary sector shows consumers for the most part did not reduce spending with high inflation levels.

The worst performing sectors were utilities, energy and consumer staples in that order. Utility stocks have not received much love from investors lately since as income stocks they have sever competition from CDs, bonds and other asset classes that pay comparable rates or even better returns. For instance, a 1-year CD paying 5% is irresistible to an investor that might have put the money in utility stocks in the past.

Note: The returns shown below are based on Total Returns which includes dividends reinvested.

Click to enlarge

Novel Investor Sector Returns QuiltSource: novelinvestor.com

Source: Novel Investor

Related ETFs:

  1. SPDR S&P 500 ETF (SPY)
  2. iShares Core S&P 500 ETF (IVV)
  3. Vanguard S&P 500 ETF (VOO)
  4. SPDR Portfolio S&P 500 ETF (SPLG)

The Complete List of stocks in the S&P 500 Index as of Jan, 2024 can be found here.

Disclosure: No positions