Apple: The King of Buybacks

Apple(AAPL) is the world’s largest company in terms of market capitalization. As of Friday, the market cap stands at $2.91 Trillion with 15.33 billion shares outstanding. The market cap of many countries’ entire stock market is lower than Apple’s market cap.

From a performance perspective, Apple’s shares have been average to poor relatively so far this year. The shares are up by 2.28% YTD. However over the past 5 years it is up by an astonishing 325% excluding dividends. Though the returns are excellent, it can be argued that much of the rise in Apple’s stock price can be attributed to its buybacks. Apple is the king of buybacks. As Apple continued to buy back its own shares its stock price soared. The following chart chart shows the buybacks vs. total shares outstanding:

Click to enlarge

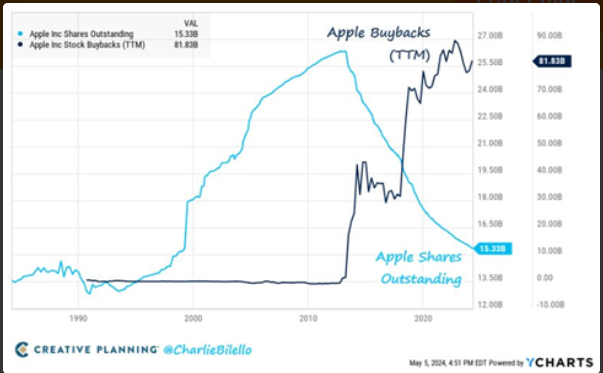
Source: @Charlie Bilello, Creative Planning

Via Thinking out loud, Syz Group

From the above article:

Apple has repurchased no less than $625 billion worth of its own shares over the past ten years, which is more than the market apitalization of 492 S&P 500 companies… The delisting of such a large number of shares partly explains the stock’s excellent performance over the past decade.

It remains to be see if Apple can continue to earn excellent returns for investors like in the past.

Related:

Disclosure: No positions

On the Year-to-Date Returns of Exchange-Listed Foreign Bank ADRs

Some of the foreign stocks trading on the US exchanges have performed very well so far this year. The S&P 500 index is up by over 10% YTD and the KBW Nasdaq Bank Index which is one trackers for bank stocks has increased by 9% YTD. Among the foreign bank stocks, Argentinean banks have soared as the newly elected President Javier Milei is restructuring the fundamentals of the economy and bring its soaring inflation under control. The three argentine bank ADRs – Banco Macro(BMA), Grupo Financiero Galicia(GGAL) and Banco BBVA Argentina S.A. (BBAR) – are up by 77% to over 95%. The following table shows the YTD returns of exchange-listed foreign bank ADRs:

S.No.Company NameTickerStock price as of May 10, 2024 closeYear-to-date Change (%)Country
1Banco MacroBMA $54.67 95.47%Argentina
2Grupo Financiero GaliciaGGAL $32.37 85.87%Argentina
3Banco BBVA Argentina S.A.BBAR $9.68 77.57%Argentina
4NatWestNWG $7.76 37.48%United Kingdom
5Barclays BankBCS $10.27 30.20%United Kingdom
6KB Financial GroupKB $53.68 27.29%Korea
7Deutsche Bank DB $16.17 19.41%Germany
8Sumitomo Mitsui FinancialSMFG $11.36 18.29%Japan
9Banco SantanderSAN $4.80 17.63%Spain
10Mitsubishi UFJ FinancialMUFG $9.91 16.26%Japan
11ICICI BankIBN $27.55 15.73%India
12Banco Bilbao Vizcaya ArgentariaBBVA $10.46 14.16%Spain
13Mizuho FinancialMFG $3.85 13.66%Japan
14HSBCHSBC $43.65 9.79%United Kingdom
15Shinhan FinancialSHG $33.72 9.26%Korea
16Bancolombia CIB $32.95 8.84%Colombia
17Lloyds Banking GroupLYG $2.57 7.95%United Kingdom
18Woori Financial Group Inc.WF $31.09 2.32%Korea
19Banco de ChileBCH $22.01 -4.03%Chile
20Banco Santander ChileBSAC $17.91 -7.44%Chile
21Itau UnibancoITUB $6.10 -10.07%Brazil
22Banco Santander BrasilBSBR $5.65 -12.21%Brazil
23HDFC BankHDB $58.14 -12.25%India
24Banco BradescoBBD $2.72 -22.00%Brazil

Source: BNY Mellon

Note: The returns shown above are as of market close May 10, 2024 and do NOT include dividends.

Brazilian banks are the in the red YTD. Brazil is known as the “Country of the Future” and it never seems to be able to unshackle itself from an emerging market to a developed market. Due to political issues and other factors, even rising copper prices haven’t helped Chilean banks Banco de Chile (BCH) and Banco Santander- Chile (BSAC) stay in positive territory this year.

It remains to be see how these banks perform thru the rest of 2024.

Disclosure: Long BCH, ITUB, BBD, CIB, SAN and BBVA

US Defense Spending in 2023 vs. The Next 9 Countries Combined: Chart

The annual U.S. defense expenditure is the largest in the world. In 2023, the U.S. spent $916 billion on defense according to a report by Peter G.Peterson Foundation quoting SIPRI data. This amount was $55 billion higher than in 2022 in part due to military aid to Ukraine in its fight against Russia.

Looking at a different perspective, the report notes that the US defense spending of $916 billion is higher than the spending of the next 9 countries combined in 2023. The following chart shows the comparison:

Click to enlarge

Source: Peter G.Peterson Foundation

One benefit of the high spending by the US, helps other countries receive free security while they spend their funds on other items. For example, Canada (not in the list shown above) spends more on social benefits and other domestic items than on defense. Same goes most of the developed countries in Europe.

The Top Personal Income Tax Rates in Europe 2024: Chart

Personal Income Tax Rates in Europe widely. In most countries the personal income tax is progressive meaning higher income earners pay higher taxes and vice versa. According to the Tax Foundation, the Top Personal Tax Rate in Europe in 2024 is in Denmark, France and Austria in that order.

Click to enlarge

Source: Top Personal Income Tax Rates in Europe, 2024, Tax Foundation

The average personal income tax rate in Europe this year is 42.8%.

Bulgaria and Romania charge the lowest rate at 10% followed by Moldova.

One Good Reason To Stay Invested: Chart

One of the topics I have discussed many before is the concept of patience and long-term investing. Holding quality stocks for many years or decades generally leads to higher returns due to the effect of compounding. Though long-term investing sounds simple it is not easy to follow for a variety of reasons. For instance, on a daily basis we are bombarded with tons of information that we have process thru. Most of it just noise and sometimes it can incredibly difficult to ignore them. I came across the below chart which shows the many events that investors were faced with from 2004 to 2023:

Click to enlarge

Source: 2024 Quick Reference Guide, AGF Investments

Some investors may been tempted to sell out when many of these events occurred. For example, the 2008 Global Financial Crisis(GFC) hit most markets of the world and it looked like all the stocks would go to zero and they would shut down the markets forever. However investors that held on all thru the chaos and continued to have faith in the markets were rewarded nicely. The above chart shows a C$10K investment would have grown to nearly $45K by the end of 2023 based on returns of the S&P/TSX Total Return Index for the Canadian market.

Related ETF:

  •  iShares MSCI Canada ETF (EWC)

Disclosure: No positions