Italian luxury auto maker Ferrari NV (RACE) is the most profitable automaker in the world. In 2023, the company shipped out just 13,663 vehicles. Total revenue in that year was 5.97 billion Euros with a profit of 1.257 billion Euros. According to industry analyst Felipe Munoz, the operating profit for each car was an astonishing 117,927 Euros. Ferrari’s net profit margin in 2023 was 21.42%.
Here is a breakdown of operating profit per unit of other automakers as calculated by Felipo Munoz of Car Expert of Australia:
Note: The figures below are in Australian $s.
| Manufacturer | Units sold (global) | Profits per unit (approx. AUD) |
| Ferrari | 13,663 | $192,221 |
| Porsche | 320,221 | $37,078 |
| Jaguar Land Rover (JLR) | 420,584 | $13,871 |
| BMW (incl. Mini) | 2,253,835 | $11,793 |
| Mercedes-Benz | 2,043,800 | $11,395 |
| Tesla | 1,808,581 | $7249 |
| Stellantis | 6,175,000 | $5906 |
| Subaru | 912,452 | $4661 |
| Isuzu | 770,000 | $4605 |
| Toyota (incl. Lexus, Daihatsu, Hino) | 11,230,000 | $4530 |
| Kia | 3,085,771 | $4283 |
| Volvo | 708,716 | $4117 |
| Hyundai | 4,216,680 | $4083 |
| Volkswagen Group (incl. Porsche, Audi, Skoda) | 9,240,000 | $3981 |
| Honda | 3,700,000 | $2892 |
| General Motors | 6,200,000 | $2765 |
| BYD | 3,024,417 | $2618 |
| Mitsubishi | 626,500 | $2608 |
| Mazda | 1,244,613 | $1954 |
| Ford | 4,400,000 | $1823 |
| Renault | 1,548,748 | $1812 |
| Nissan | 3,374,271 | $1773 |
| Suzuki | 213,320 | $1463 |
| GWM | 1,230,000 | $462 |
| Aston Martin | 6620 | -$31,554 |
Source: Ferrari’s profit per vehicle puts every other brand in the shade, Car Expert
The below cool infographic shows how many units other auto manufacturers have to sell to beat Ferrari’s profit per unit:
Click to enlarge
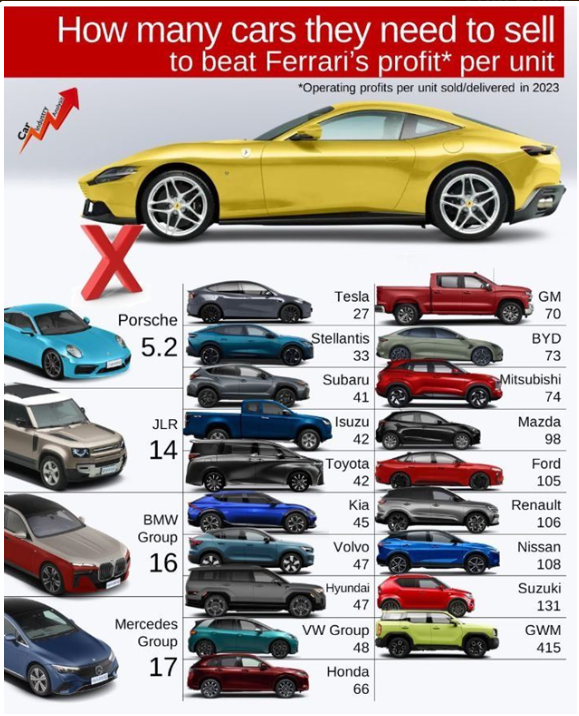
Source: @MichaelAArouet via syz Group
Ferrari listed its stock on the NYSE in Oct, 2015. Since then the stock has soared by over 638% as the chart shows below:
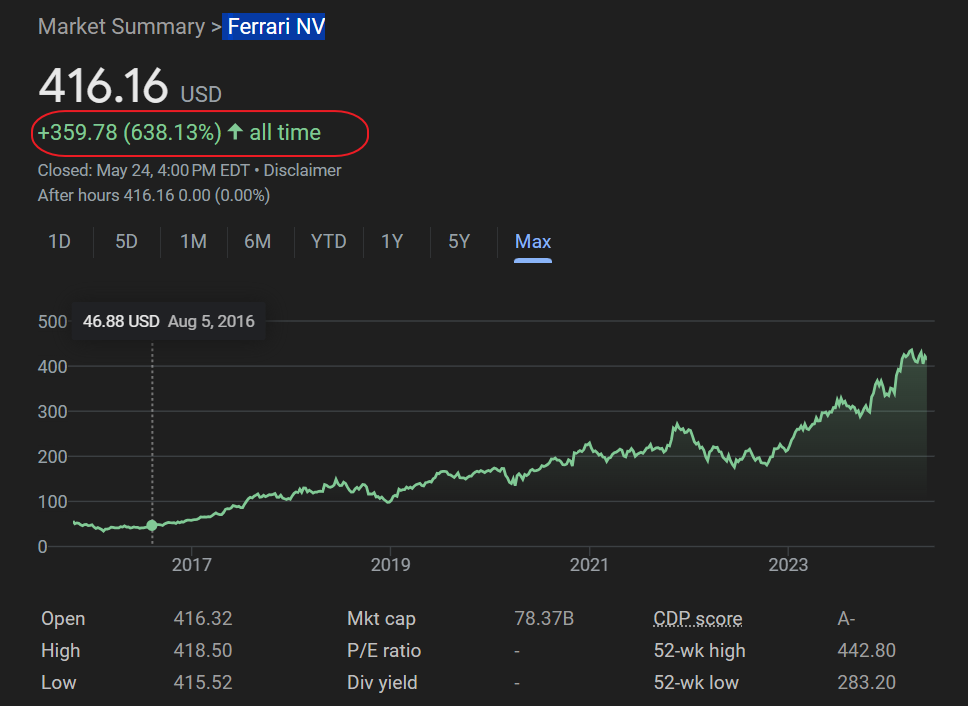
Source: Google Finance
The following chart shows the 5-year returns:
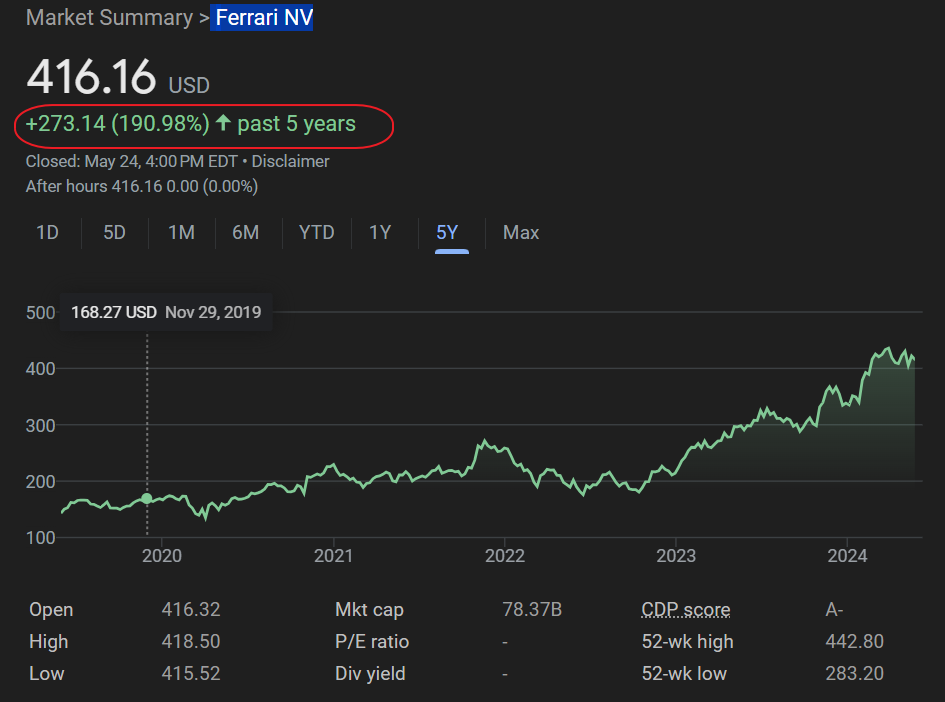
Source: Google Finance
Currently Ferrari has a market cap of $78 billion. This is higher than the market caps of Stellantis N.V(STLA) and General Motors Co (GM).
Investors who got in on the IPO or even picked up the stock in the past few years have enjoyed excellent returns.
Disclosure: No positions