The world leaders in Industrial gases specifically hydrogen are Linde(LIN), Air Liquide(AIQUY) and Air Products and Chemicals(APD). In addition to hydrogen and other gases, they also produce oxygen which is in high demand during this pandemic. For instance, Linde is major supplier of oxygen in many emerging countries. With millions of Coronavirus patients requiring oxygen the demand is exceeding supply in some countries.
With that said, all three stocks had great run this year until recently when they fell some after reporting earnings. The following chart shows the year-to-date returns of the three stocks:
Click to enlarge
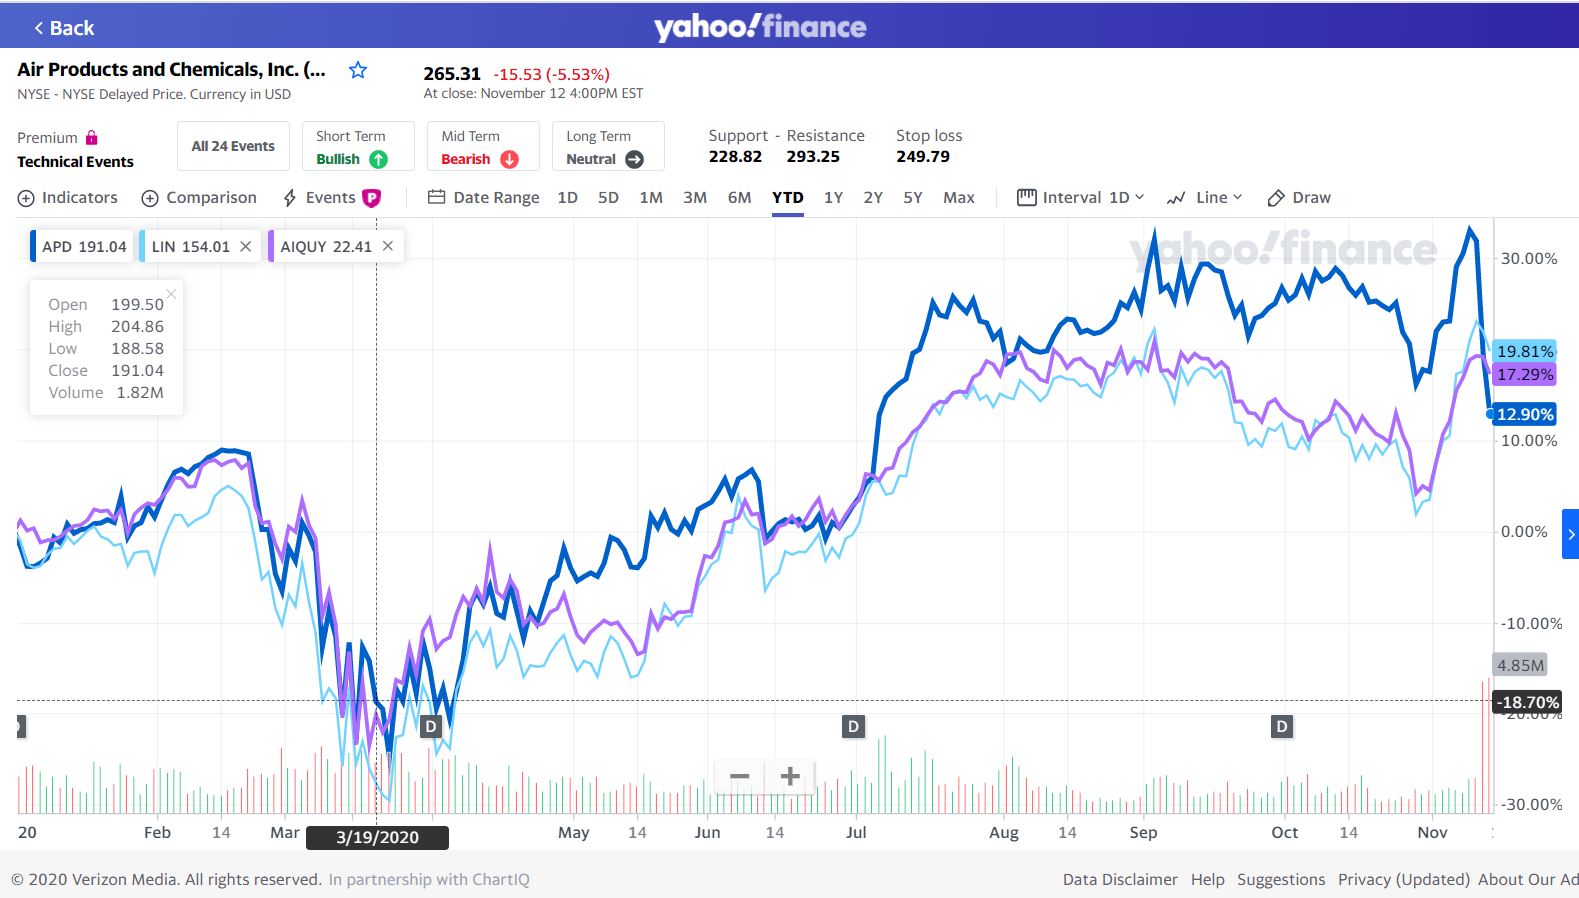
Source: Yahoo Finance
Below is a brief excerpt from a journal article:
Linde, Air Liquide and Air Products have advantages over newcomers. Hydrogen is very volatile, and they already know how to safely produce, store and transport it. Their current industrial customers are also likely to be hydrogen buyers in the future and they have been investing in clean hydrogen pilot projects and new technologies.
Linde is the global leader after the German company merged with U.S. rival Praxair in 2018. It only funds hydrogen projects that provide double-digit internal rates of return, just like its other investments. Its joint venture with ITM Power also provides a link to promising electrolyzer technology used to make carbon-free, or green, hydrogen.
Based in Allentown, Pa., Air Products and Chemicals has a bolder approach, investing in larger hydrogen projects with more experimental technologies. In July, the company announced it will contribute $3.7 billion to the $7 billion project to build a green-hydrogen facility in Neom, a futuristic megacity to be built in Saudi Arabia. Its stock has outperformed its peers this year, perhaps because it has absorbed more of the hydrogen hype. The gas accounts for roughly 25% of its revenue, compared with around 10% for the larger European companies.
Source: The Industrial Giants That Could Get a Lift From Hydrogen. WSJ
Disclosure: No Positions