The 2020 Vanguard Index Chart: Australian Edition

One of the main factors for success with investing in equity markets is the ability to stay in the market regardless of market conditions. Trying to get out and get in is a fool’s game. Markets can move violently in both directions in a short span of time and its impossible to know when that might happen.

Stay the course. No matter what happens, stick to your program. I’ve said “stay the course” a thousand times, and meant it every time. It is the most important single piece of investment wisdom I can give to you. – John C Bogle, Founder of Vanguard

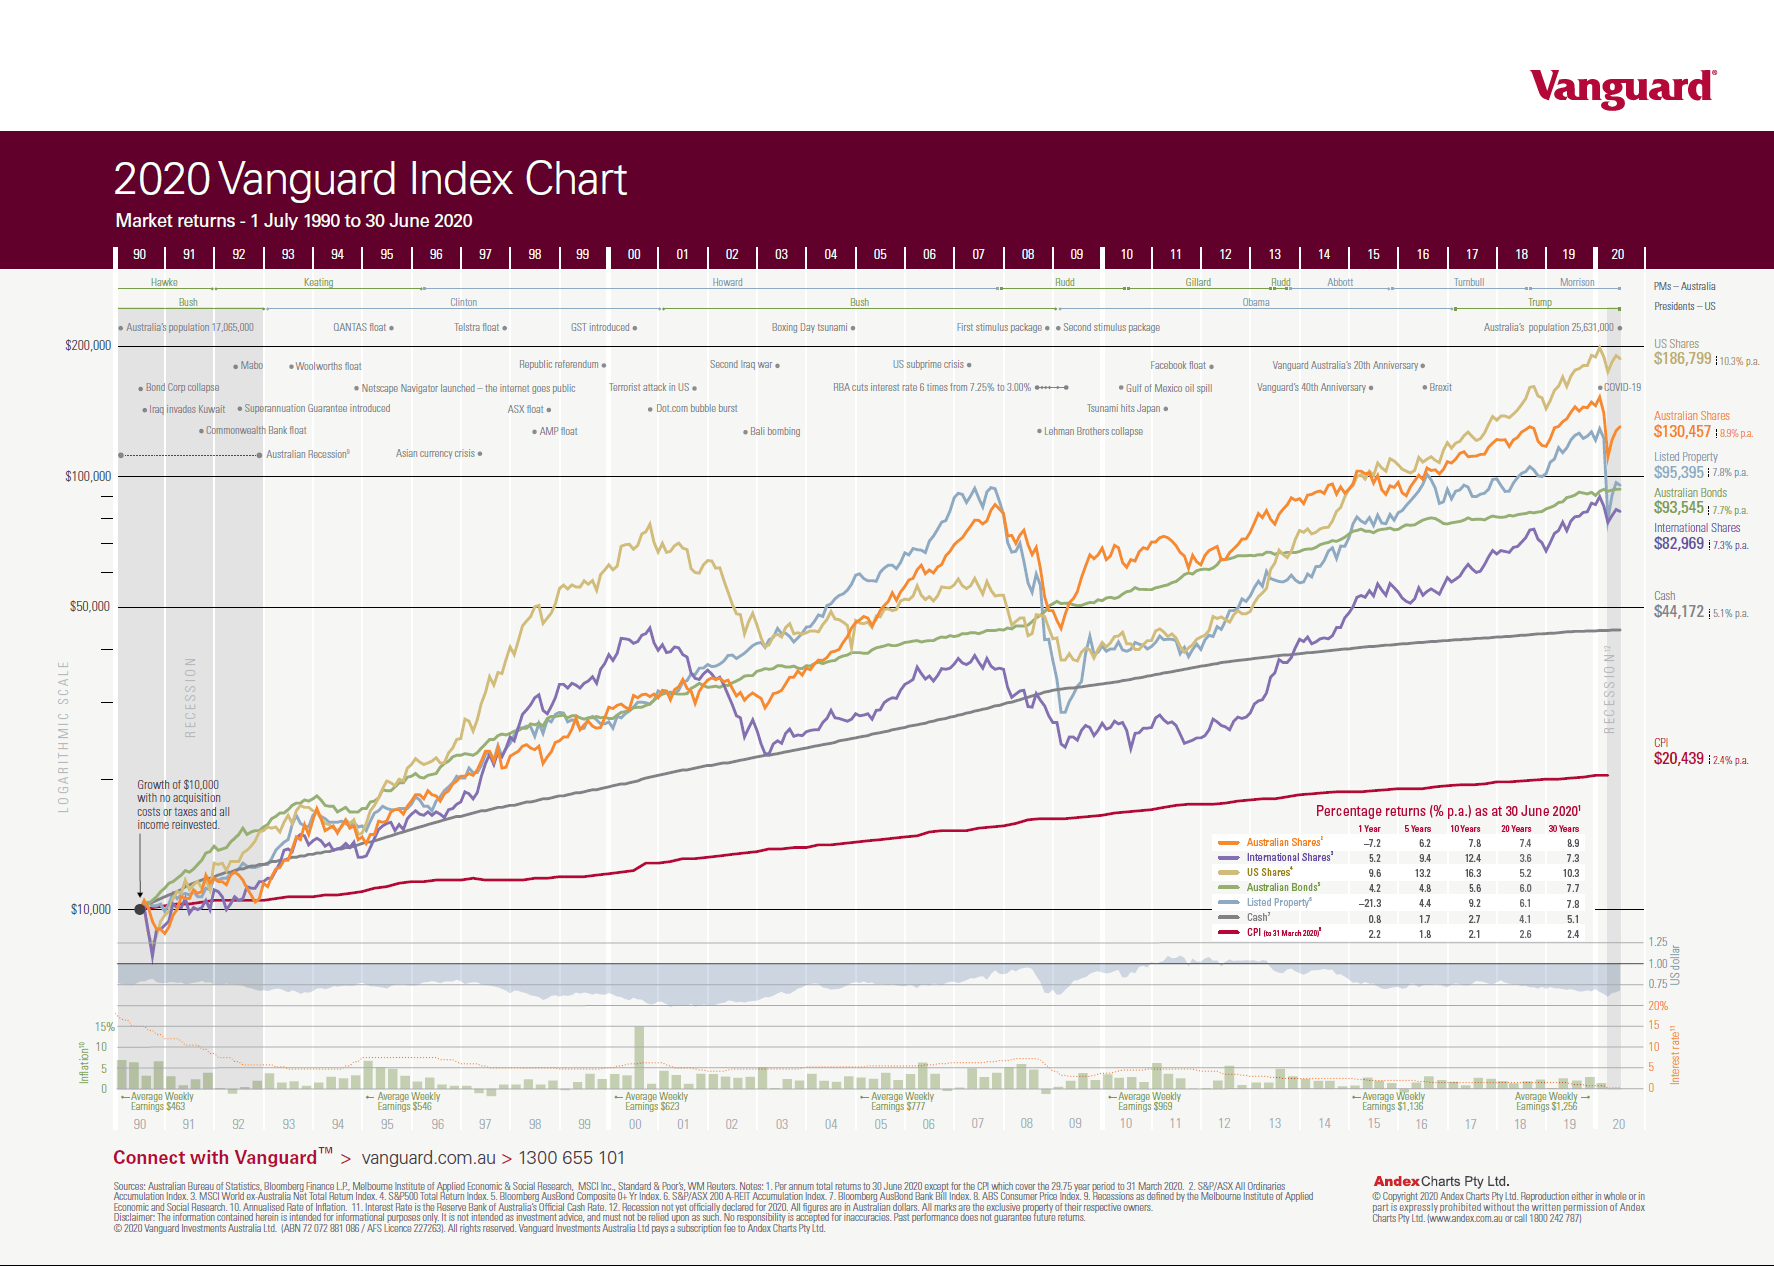
The following chart from Vanguard Australia showing the returns of various assets over the long-term (from July 1990 to June 2020) for the Australian market:

Click to enlarge
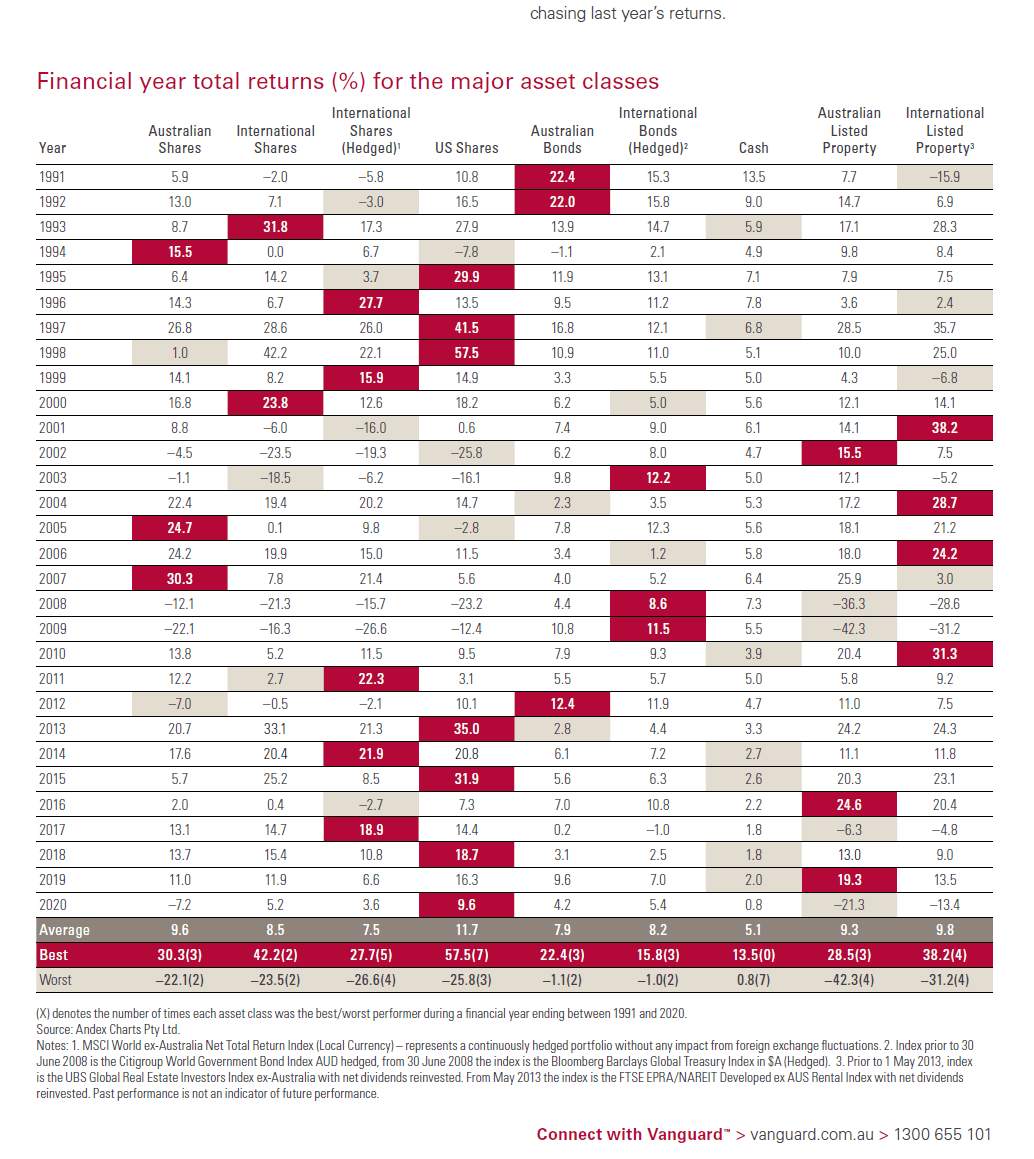
The table below shows the 30 year returns for various Australian assets:
Source: Vanguard Australia

Related:

Disclosure: No Positions


20 Facts About The North American Economy: Infographic

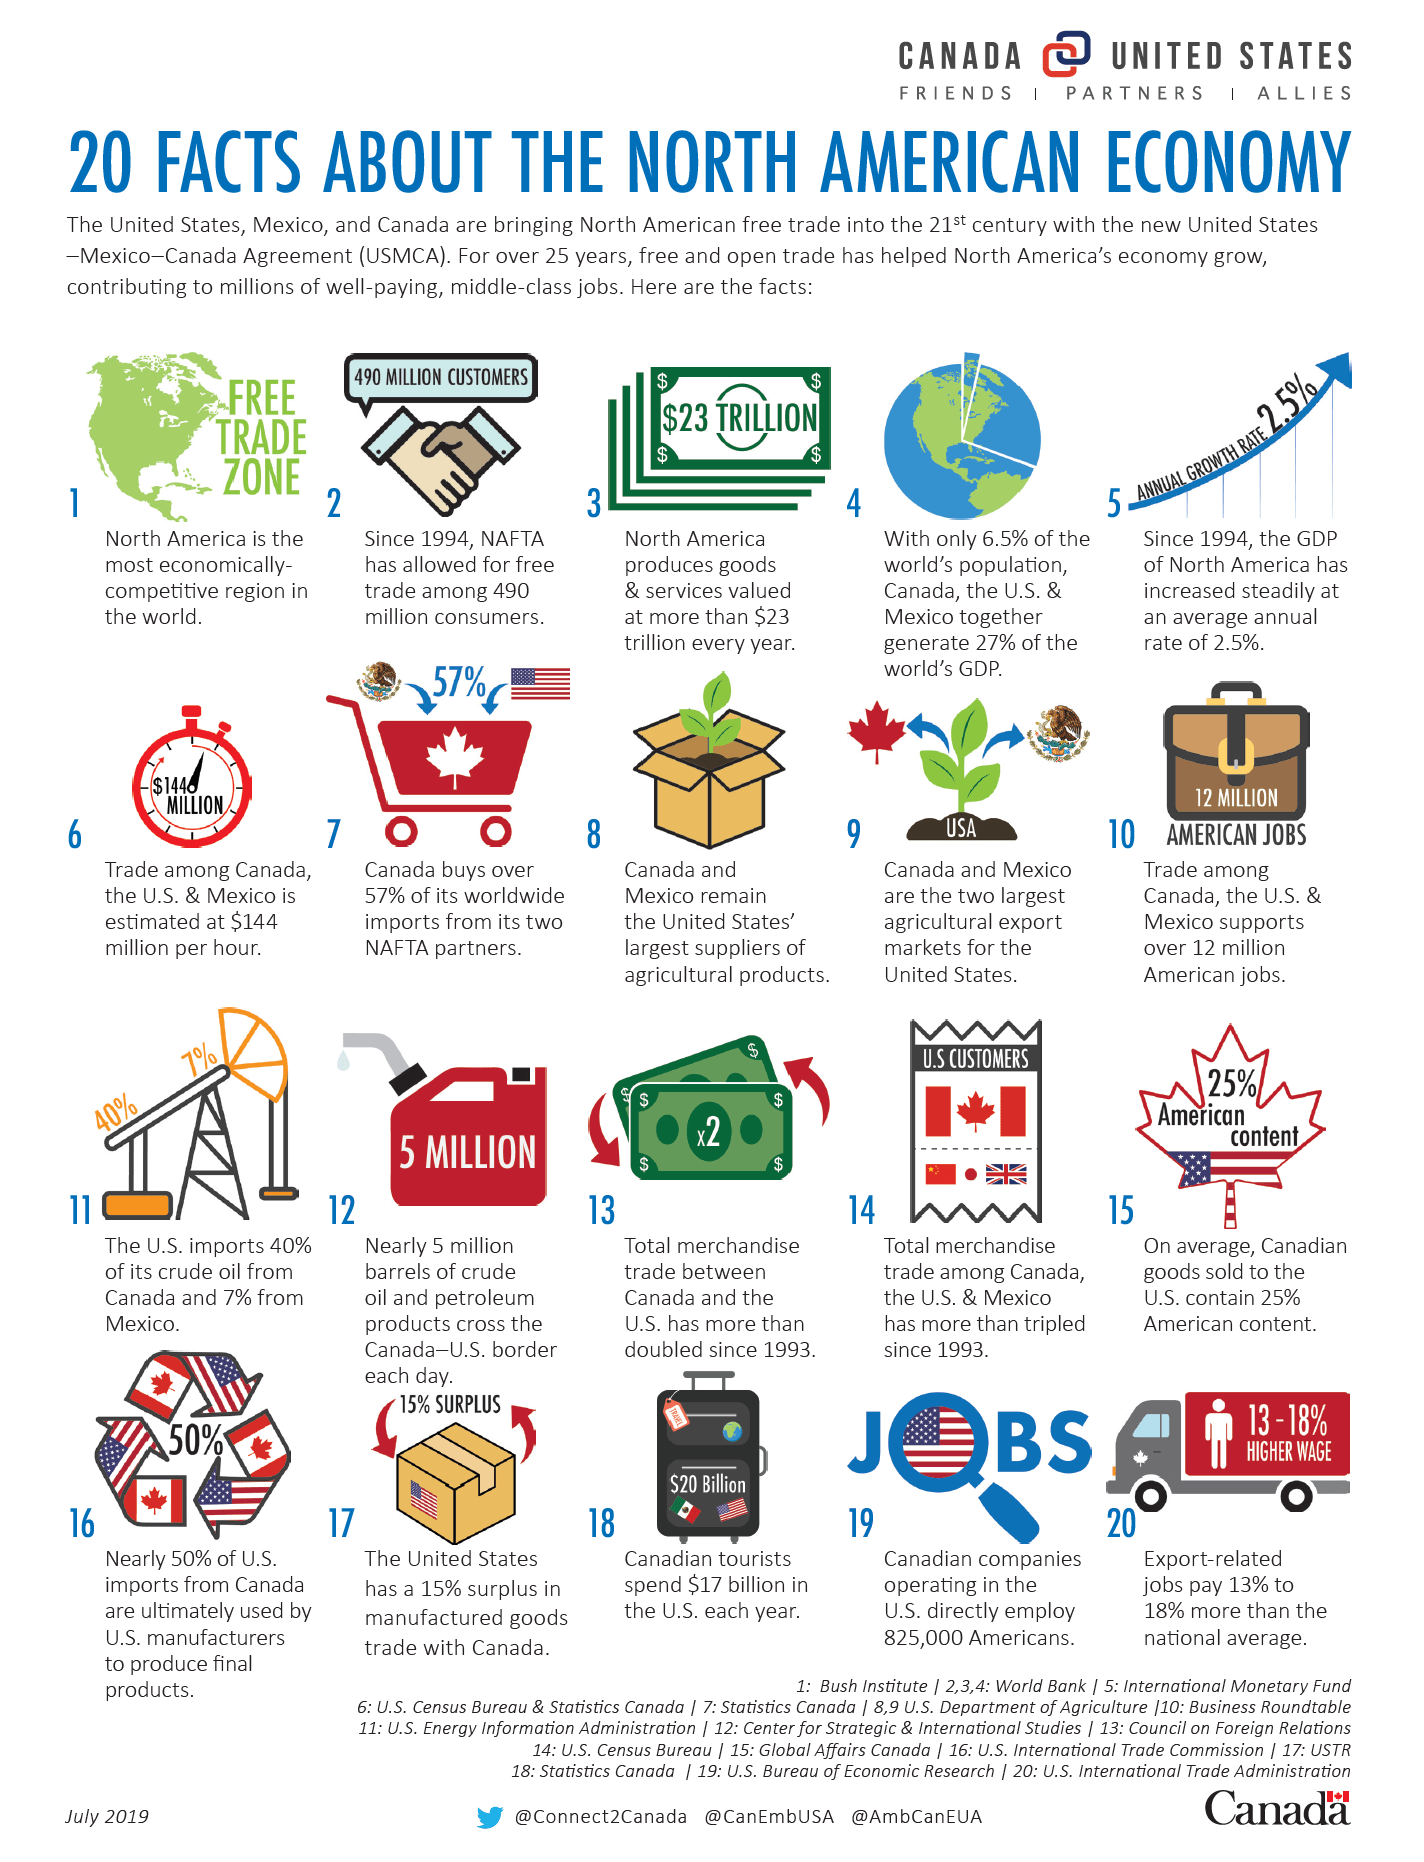
The trading bloc between the US, Canada and Mexico is one of the largest in the world. The three countries are covered by the United States-Mexico-Canada Agreement (USMCA) agreement that replaced North American Free Trade Agreement (NAFTA) earlier this year. The agreement allows for free flow of goods and services between the countries. The benefits of the USMCA and the NAFTA before that are immense to say the least. The following infographic shows 20 facts about the North American Economy:

Click to enlarge

Source: liencanada.com

Chinese Electric Car Maker NIO Has Soared 1,231% Year-to-Date

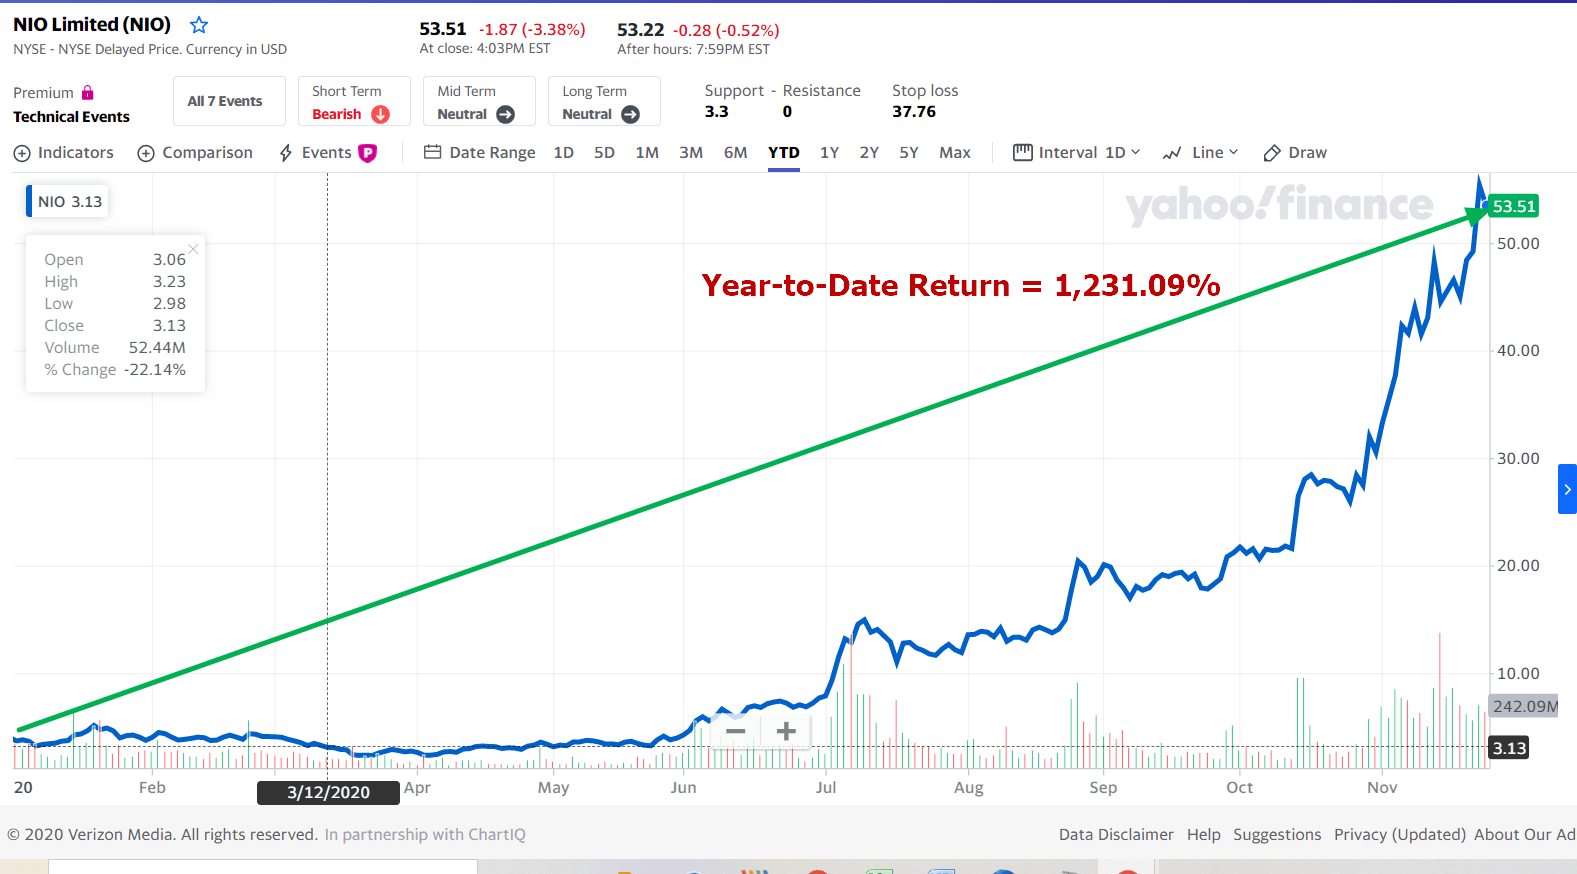
Stocks of electric vehicle makers are red-hot on Wall Street this year. While Tesla(TSLA) is the most popular of them all, other lesser known companies are also riding the bandwagon. China-based NIO(NIO) is one example. NIO’s traded under $4.00 in the beginning of the year. Yesterday it closed at $53.51 for a growth of 1,231.09%. This rate of growth within a year is astonishing indeed.

Click to enlarge

Source: Yahoo Finance

NIO’s current market capitalization is about $73.0 billion. The company reported just $629 million in revenue for the last quarter.

Inquiring minds are wondering how high is too high for NIO.

You may want to check out:

Related:

Disclosure: No Positions


What Are National Oil Companies? : Chart

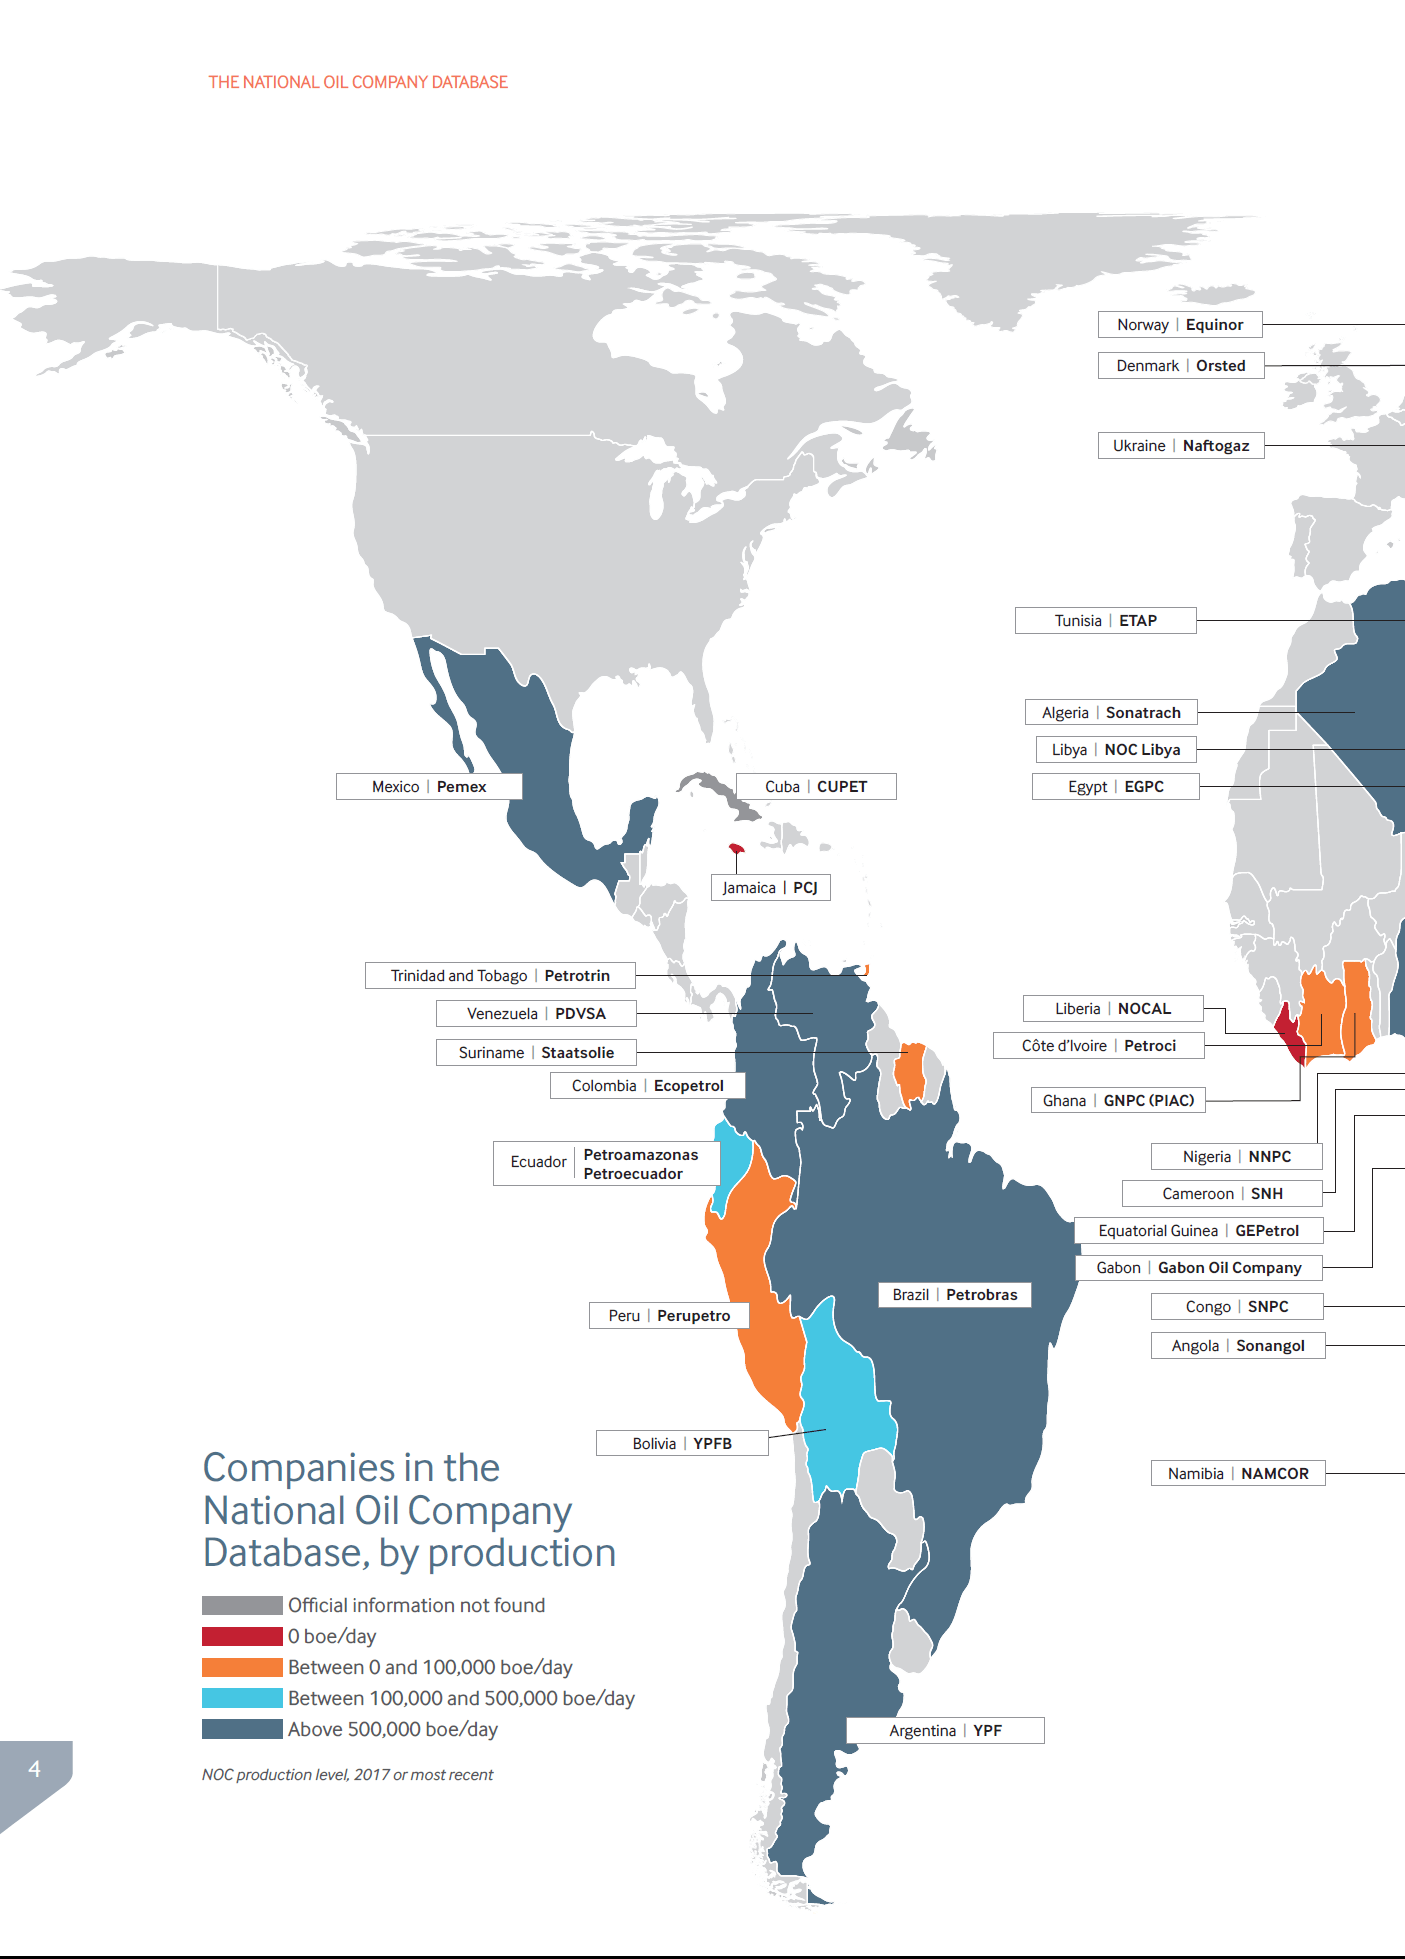
National Oil Companies (NOCs) are owned fully or partially by the state. Unlike the major supermajors like Exxon Mobile(XOM), BP(BP), Total(TOT), etc. the NOCs are controlled by the state though they may publicly listed as well. Some of the large oil companies in the world such as  China Petroleum & Chemical Corp (SNP) and PetroChina (PTR) of China, Petrobras (PBR) of Brazil, Equinor (EQNR) of Norway are NOCs. The map below shows the NOCs by country:

Click to enlarge


Source: The National Oil Company Database, Resource Governance

Disclosure: Long PBR

Number of Nurses by Country: Chart

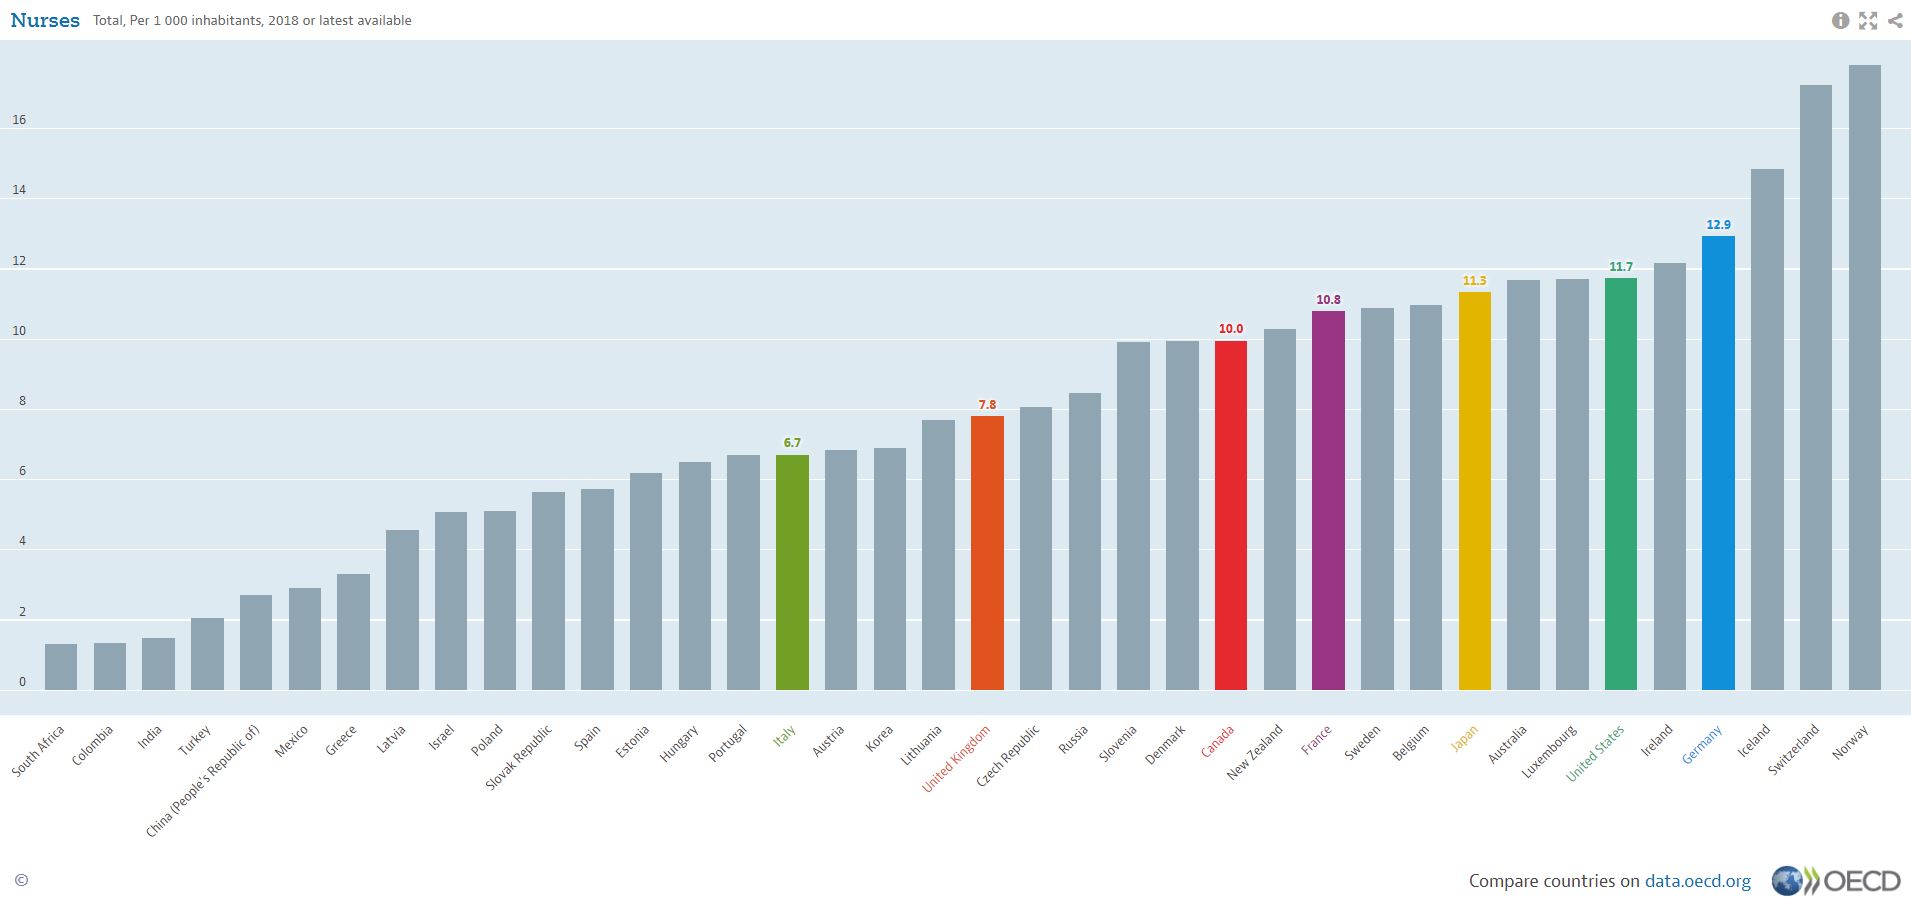
This post is a follow-up to a post from earlier this year where I discussed about the doctors per capita in OECD countries. As the vaccines for Covid-19 gets rolled out nurses will be one of the key workers in the health care sector involved in the administration of the vaccines. The following chart shows the number of nurses per 1,000 residents. Norway has the highest number of nurses on a per capita basis among OECD countries.

Click to enlarge


Source: OECD