A few years ago I wrote a post on how the largest companies change over time and it was well received by readers. Going back to that theme, in this post let’s take a took at how global banks also change over time. To put it another way, no company or bank tend to be at the top forever. As times change so do the leadership. I recently came across a piece at FirstLinks, Australia by Hugh Dive of Atlas Funds Management. The following charts are from that excellent article.
He noted that in early 1980s four of the top 10 global banks were French. But by 1990s they fell off the list as they were nationalized by the Mitterrand government.
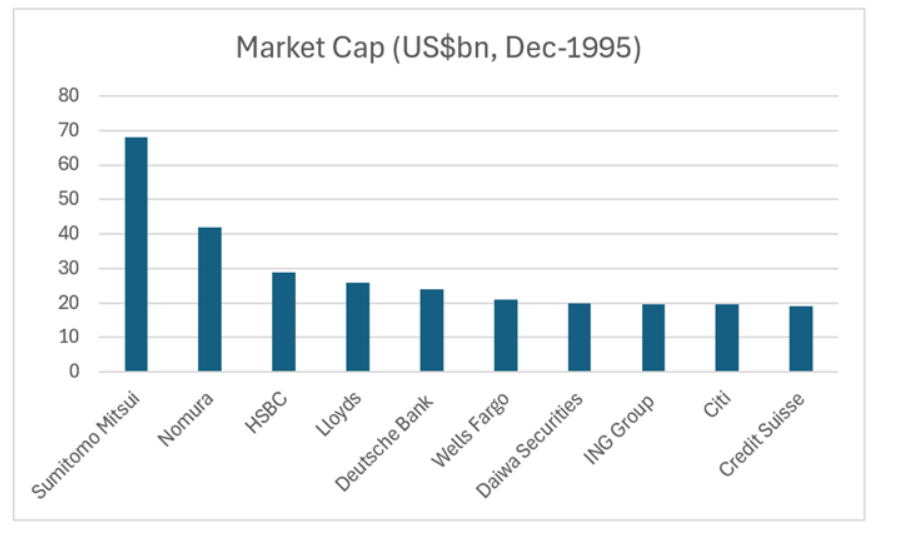
In 1995, Japanese banks appeared in the ranking with Sumitomo, Nomura and Daiwa as shown below. In addition European banks like Llyods(LYG), Deutsche Bank(DB), ING (ING), Credit Suisse and HSBC (HBC) dominated the list. That is no longer the case today as we see later in the post. In fact, Credit Suisse collapsed and was absorbed by UBS.
The World’s Top Banks by Market Cap in December,1995:
Click to enlarge
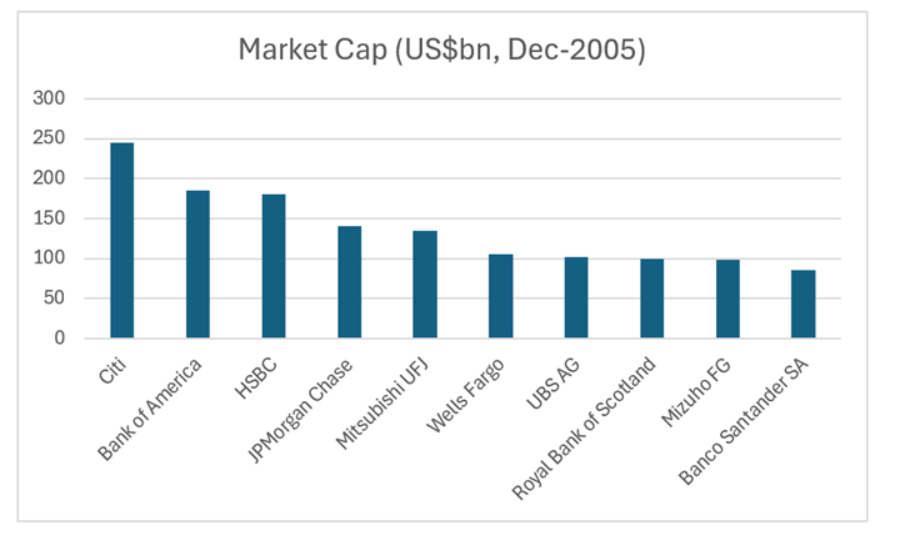
By 2005, US banks started attaining global leadership with Citi(C) at the top. Royal Bank of Scotland (RBS ) failed during the GFC and had to be bailed out by UK. Interestingly Spanish banking giant Santander (SAN) was the 10th largest bank at that time.
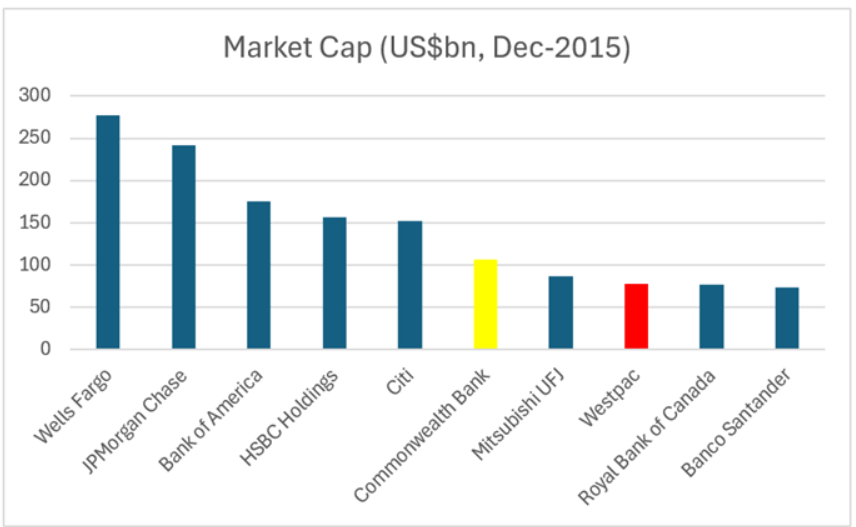
In 2015, two of Australia’s major banks – Westpac and Commonwealth(CMWAY) – appeared in the world’s largest 10 banks. Canadian banking group Royal Bank of Canada(RY) also reached this list.
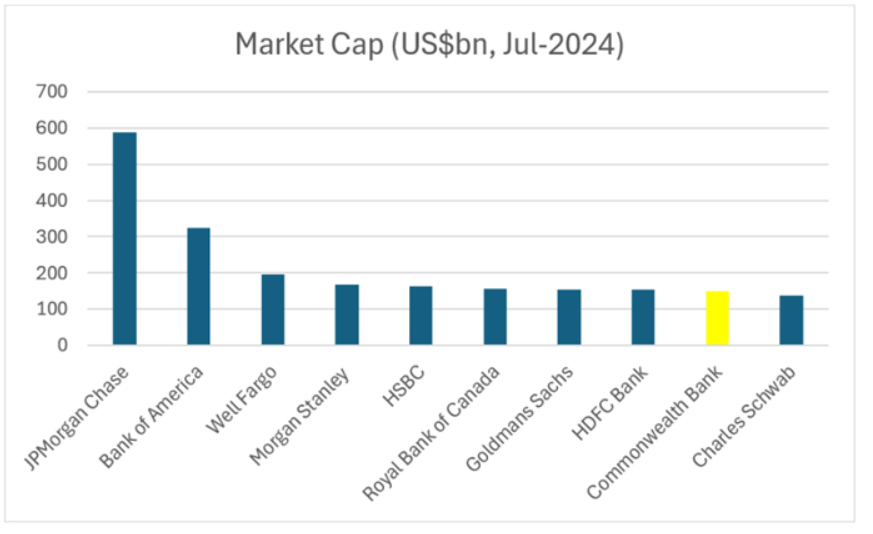
As mentioned earlier, leadership does not stay always with the same banks. In mid-2024, we see that American banks dominate the ranking. Westpac has dropped out and only Commonwealth Bank of Australia remain in the list. It should also be noted that one of India’s largest bank HDFC Bank(HDB) is now the 8th largest bank in the world. European banks have lost billions in market caps since the Global Financial Crisis and then multiple crises in the continent including many sovereign debt crisis over the years. No wonder most of them have disappeared from this list.
Source: Are Australian banks headed for a fall?, High Dive, Firstlinks
The key takeaway for investors in banking stocks is that leadership evolves over time and hence they should formulate their investment strategies accordingly.
Disclosure: Long SAN, ING, Westpac, RY