One of the important concepts to be aware of with equity investing is the survivorship bias. Simply put this theory means ignoring losers and focusing on winners which can skew one’s thinking or results. For instance, hundreds of biotech firms are launched in the public markets but only a handful or even less are highly successful. Most biotech stocks end up being average or even worth less after a few years. However a select few such as Moderna(MRNA) and BioNTech(BNTX) turn into stars from their IPOs. Any analysis that ignores the biotech failures and simply concentrates on these firms would lead an investor to believe biotechs can create huge wealth easily.
Here is the definition from Wikipedia:
Survivorship bias or survival bias is the logical error of concentrating on the people or things that made it past some selection process and overlooking those that did not, typically because of their lack of visibility. This can lead to some false conclusions in several different ways. It is a form of selection bias.
Survivorship bias can lead to overly optimistic beliefs because failures are ignored, such as when companies that no longer exist are excluded from analyses of financial performance.
Recently I came an article on valuation multiples aptly titled Why valuation multiples fail in an exponential world. In this piece the author Amit Nath explains his theory using the examples of tech giants Microsoft(MSFT) and Amazon (AMZN). Of course this is cherry picking to the nth degree. In the dot com era hundreds of firms like Infospace, JDSU, eToys, Exodus, Looksmart, etc. disappeared forever. Even survivors like Intel(INTC), Cisco(CSCO), etc. caused losses in the billions for investors. The author makes the classic mistake of survivorship bias by high-lighting two winners from the dot com wreckage. He even shows the below chart that proves what a great stock Microsoft has been:
Click to enlarge
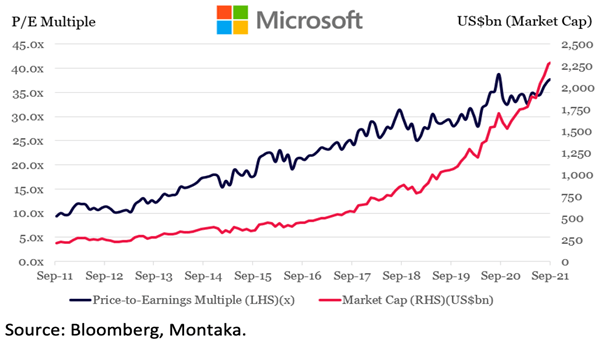
Source: Why valuation multiples fail in an exponential world, Montaka Global Investments. via FirstLinks
He makes the case for further growth in Microsoft’s share price with this statement:
In fact, under our bullish scenarios, we believe Microsoft’s share price could increase several fold, even from here.
Microsoft closed at over $309 a share on Friday and has a market cap of $2.32 Trillion. If Microsoft’s stock price increases 10-fold from here then its market cap would exceed the US GDP.
Similarly Amazon lost money for years and years before turning a profit. A variety of factors including the craze for cloud, the pandemic, etc. led to the soaring stock price.
Survivorship bias can also be found in the world mutual funds. Fund companies routinely get rid of poorly firming funds by merging them with well performing funds. This process magically eliminates the worst performers from the funds list and makes funds rating look better over the long run.
So the key takeaway is that investors need to be wary of articles that cherry pick a few stock to support a conclusion and avoid the big picture.
Disclosure: No positions