The dividend yield on the S&P 500 is small relative to other developed markets. Currently the dividend yield is at 1.74%. For many years the rate has hovered around the 2% mark. Though the yield may seem insignificant over the years due to compounding the total return gets amplified due to dividends’ contribution. For example, from 1930 to 2021, 40% of the annualized total return on the S&P 500 was derived from dividends and their reinvestment and the remaining from capital appreciation according to an article at Nuveen:
Click to enlarge
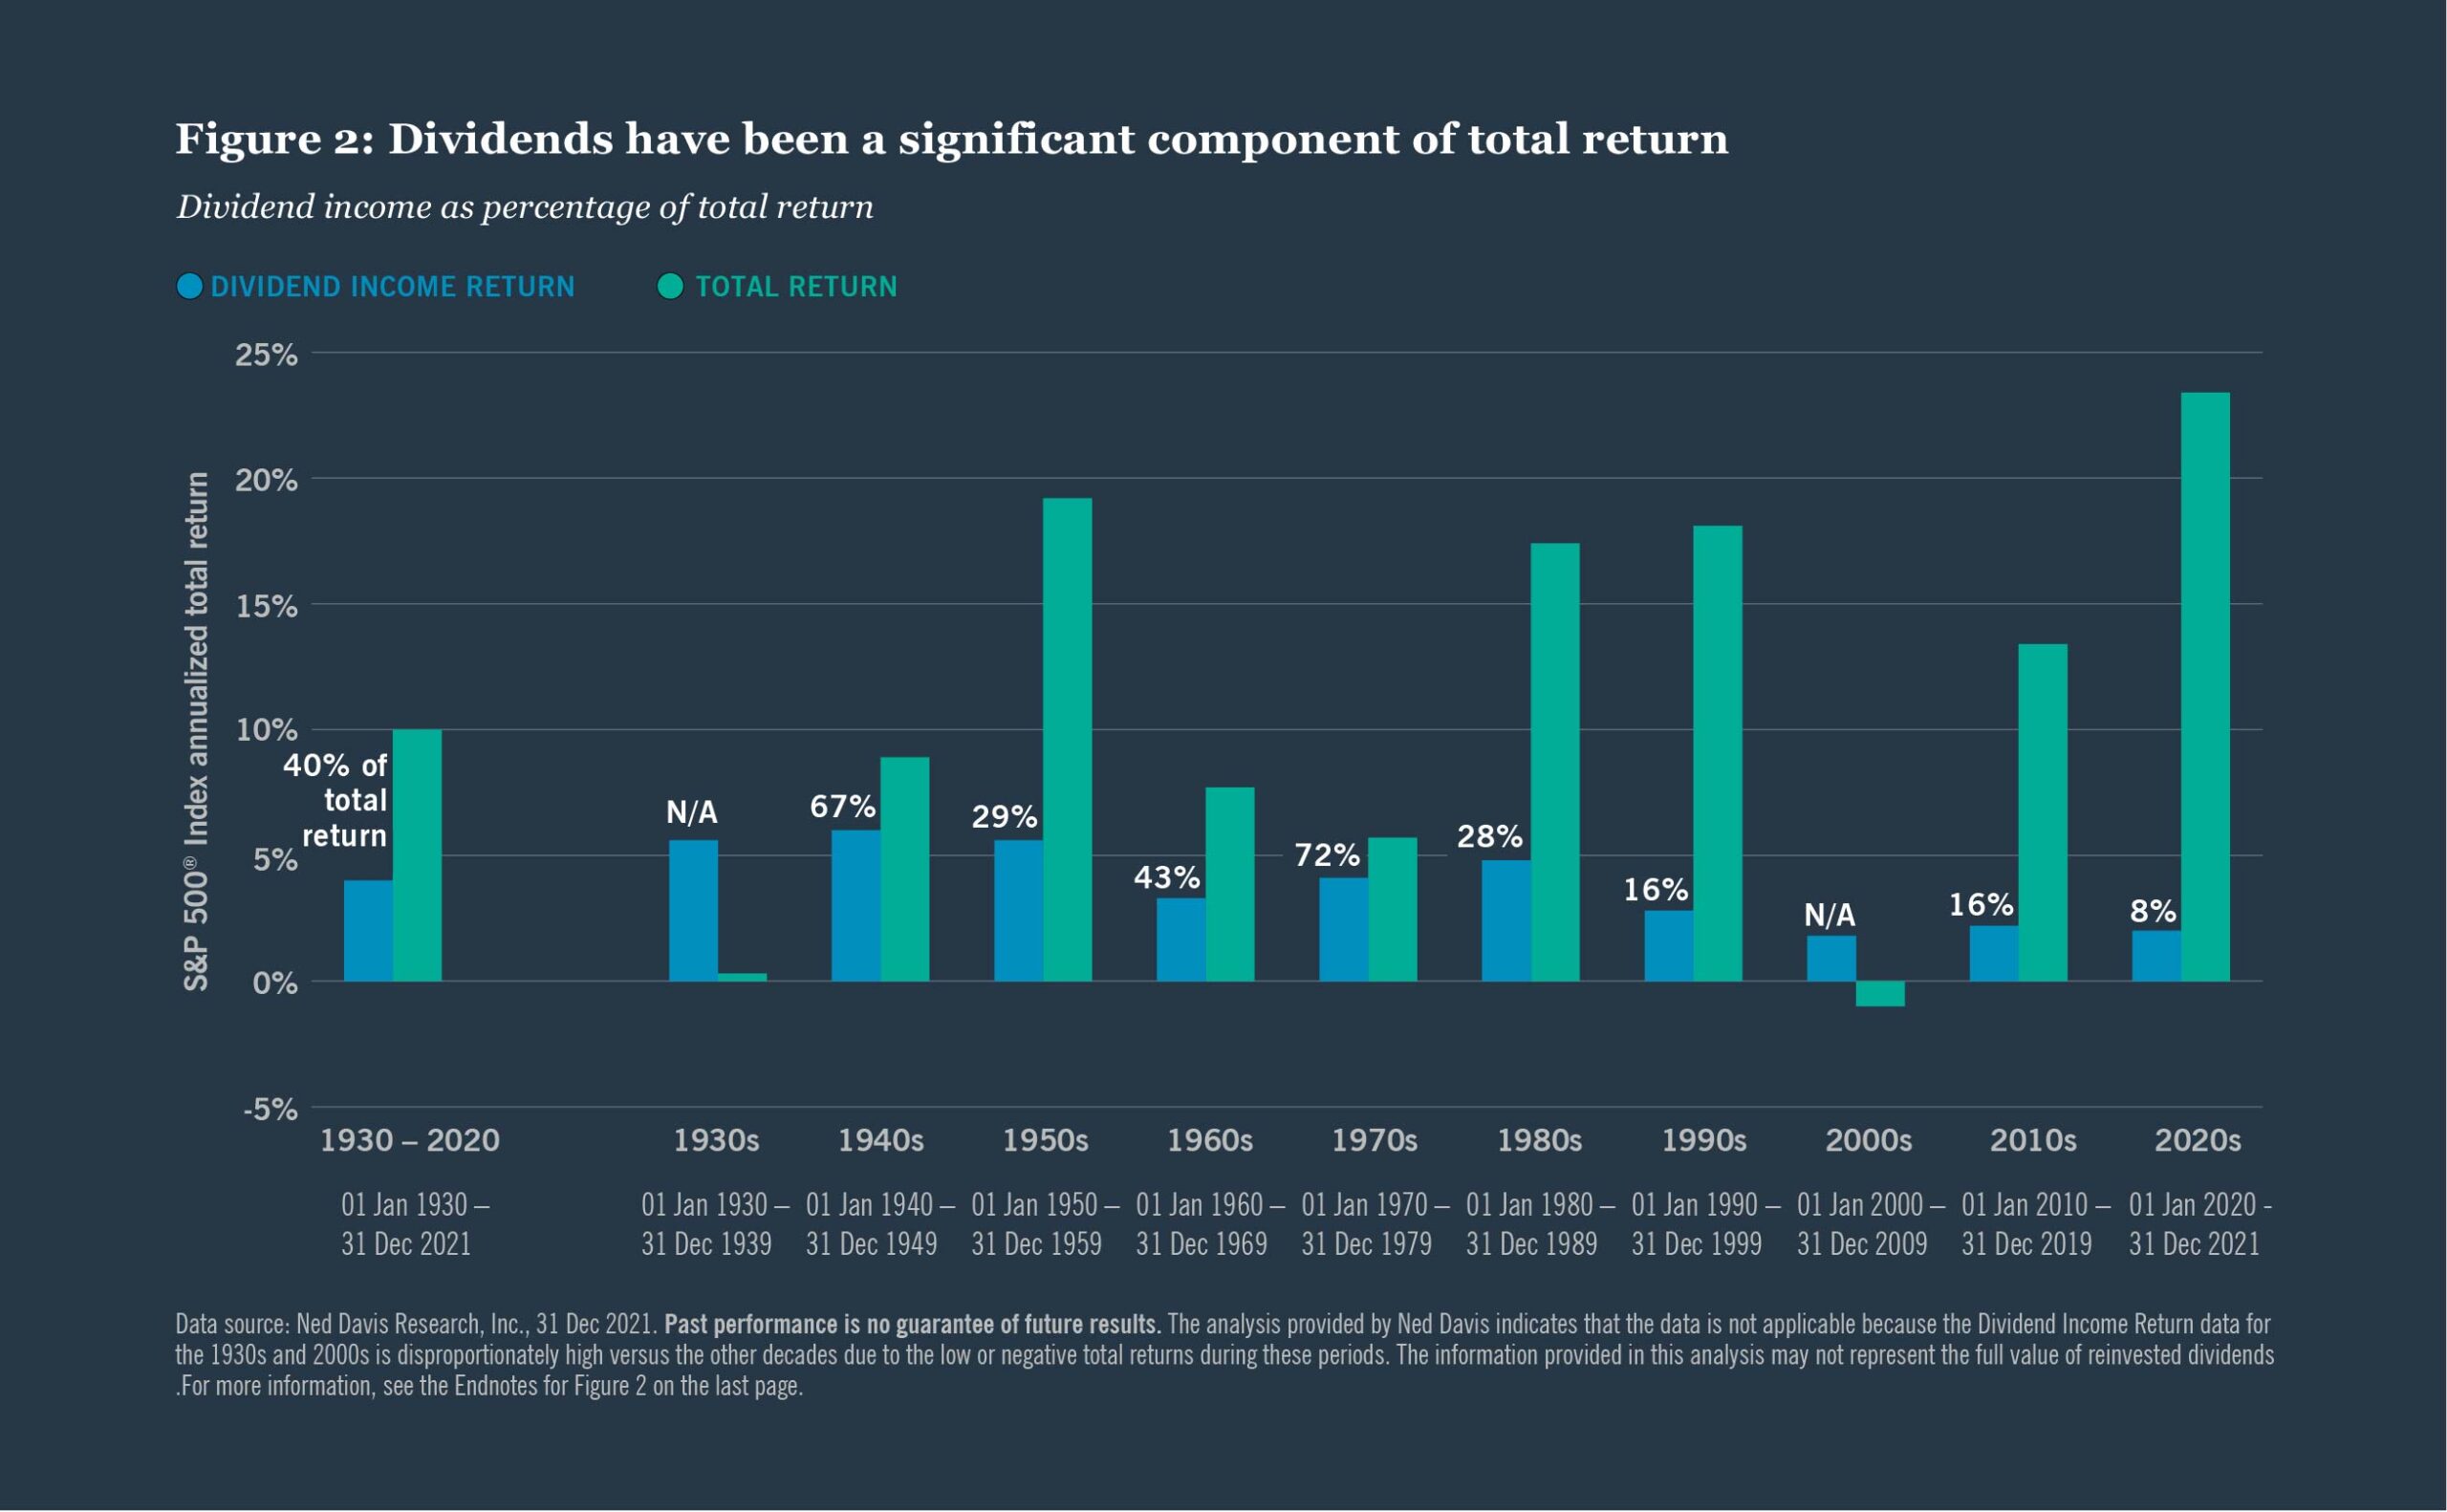
Source: Why dividend growth?, Nuveen
The following chart takes a different perspective and shows the S&P 500 composite total return decomposed by decade from 1900 to 2021:
Click to enlarge
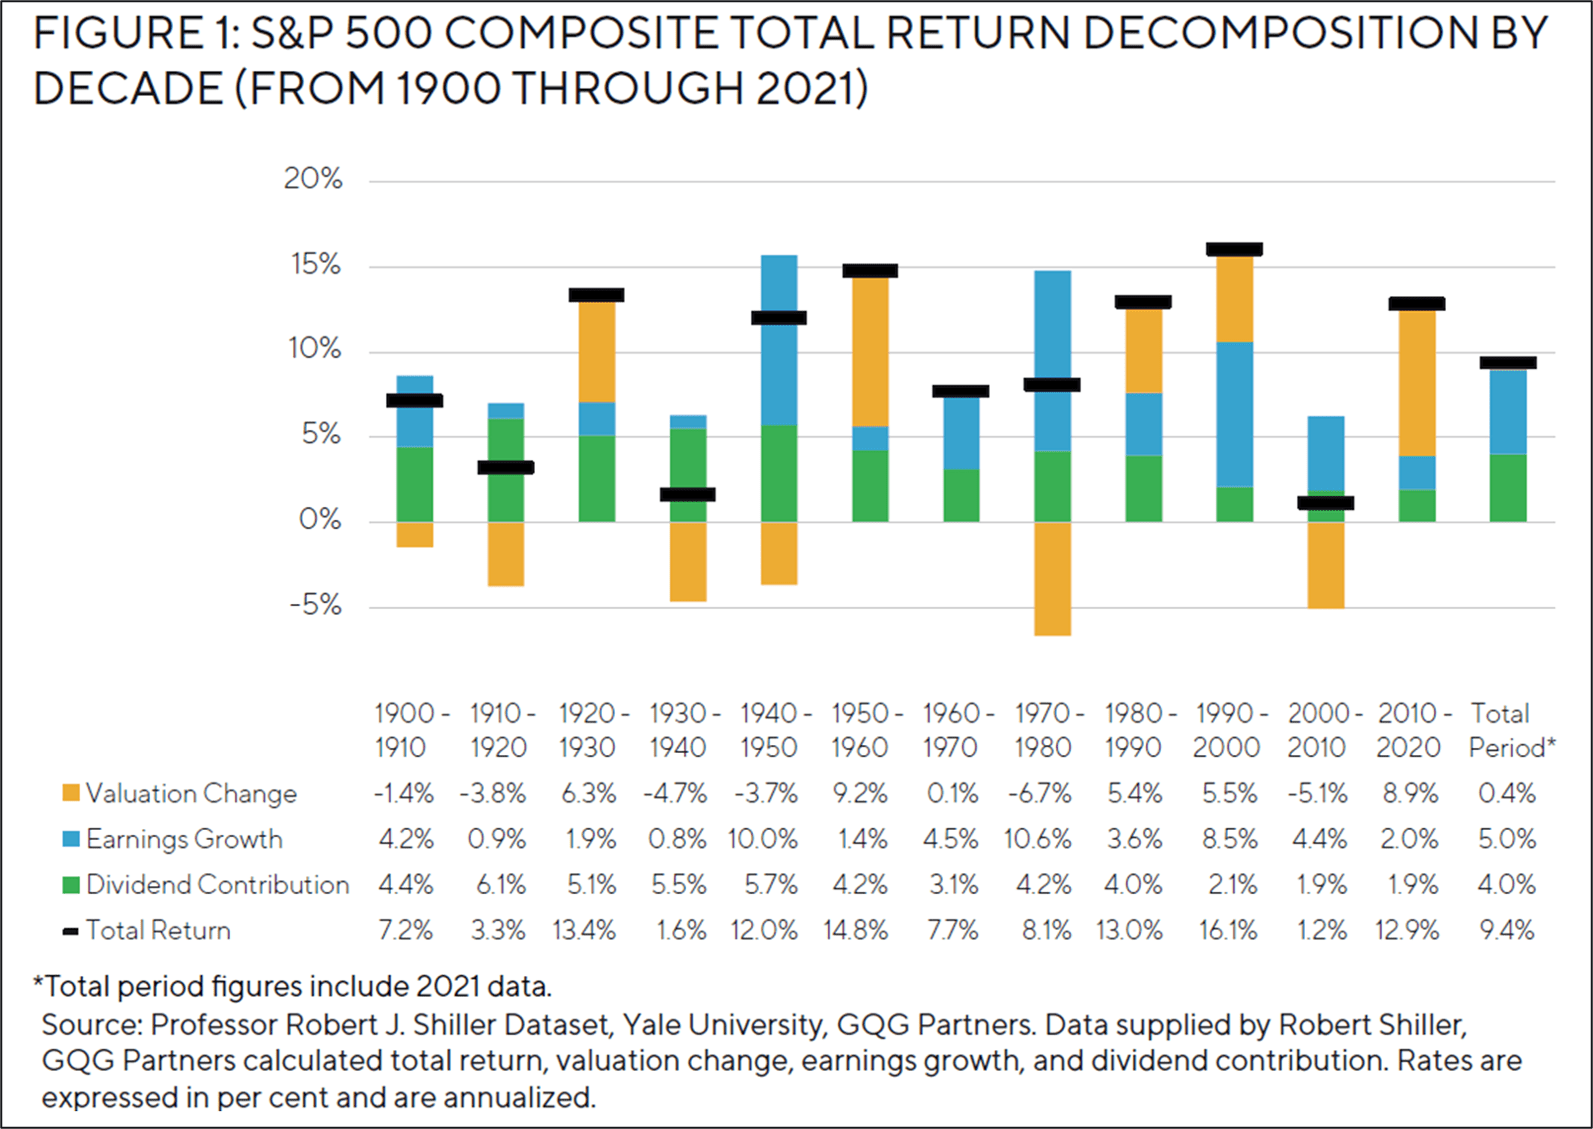
Source: Dividend Investing for Uncertain Markets: A Quality-First Approach, GQG Partners
A short excerpt from the above piece:
Over the last 121 years of the S&P 500 Index’s total nominal return of approximately 9.4 per cent, dividends (represented by the green bars) and earnings growth (represented by the blue bars) contributed roughly 4.0 per cent and 5.0 per cent, respectively. Changes in valuation (represented by the bronze bars) – or the speculative contribution to returns despite the attractive results over the most recent decade – have mostly been an unpredictable source of price volatility with a lackluster long-term contribution to total return.
Both the above linked articles are worth a read.
Related ETFs:
- SPDR S&P 500 ETF (SPY)
- iShares Core S&P 500 ETF (IVV)
- Vanguard S&P 500 ETF (VOO)
- SPDR Portfolio S&P 500 ETF (SPLG)
Disclosure: No positions


