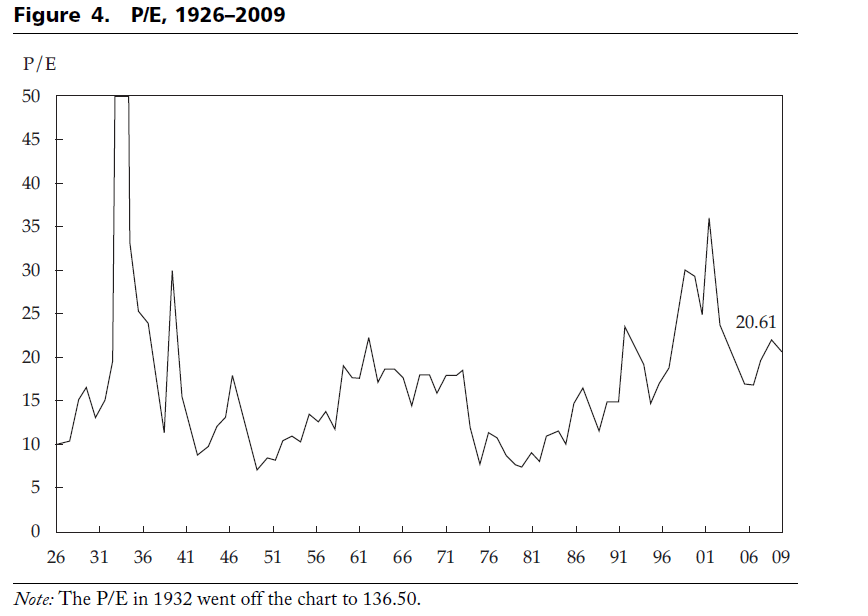
The historical P/E ratio of the S&P 500 1926 to 2009 is shown below:
Click to enlarge
The Price to Earnings (P/E) ratio was at 10.22 in the beginning of 1926 and reached 20.61 in 2009—an average increase of 0.84% per year. The highest P/E ratio was 136.50, recorded during the bull market in 1932, and the lowest was 7.07, recorded in 1948.
The P/E ratio has never gotten to a level less than 5, even through the Great Depression during the 1920s and 1930s and the 2008–09 global financial crisis.
The P/E rose dramatically over the past 80 years because investors believed that corporate earnings would grow faster in the future. However this is unlikely to continue in the future as corporate earnings are projected to be sluggish.
Source: Will Bonds Outperform Stocks over the Long Run? Not Likely” by Peng Chen, CFA of MorningStar Investment Management and Roger Ibbotson, Ph.D. of Yale School of Management and Ibbotson Associates
Related ETF:
SPDR S&P 500 ETF (SPY)
Disclosure: No Positions
