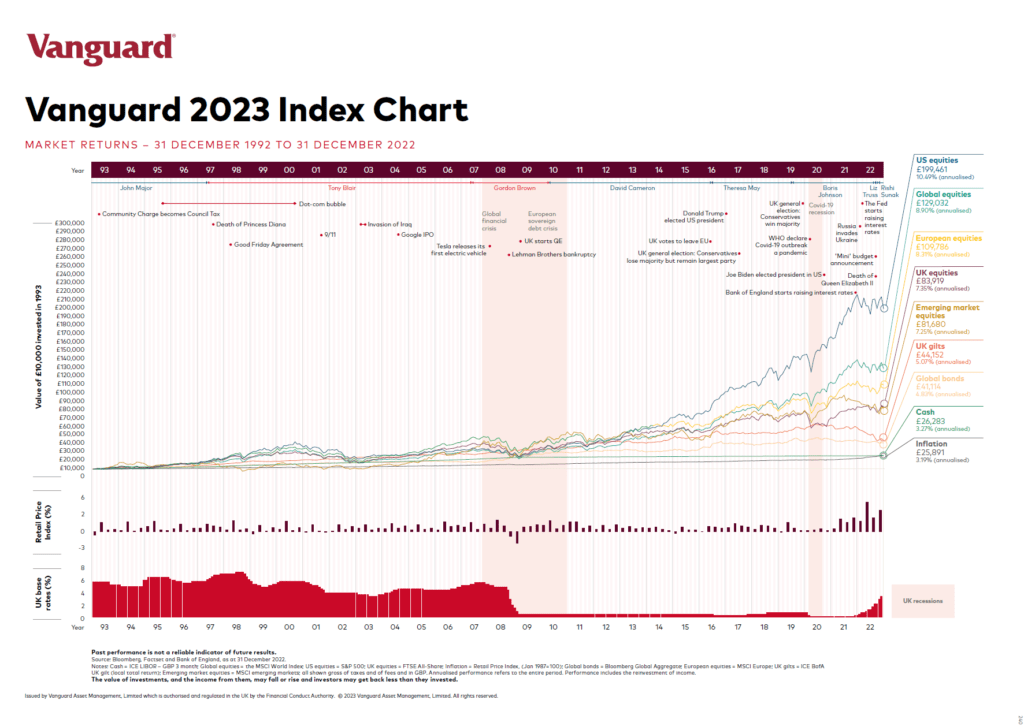
We reviewed The Vanguard Index Chart for Australian equities in an earlier post. In this post, let’s take a look at a similar chart for the UK market. British stocks have underperformed poorly relative to US stocks for the period from 1992 to 2021 as shown in the chart below. Since 1992, US stocks would have earned an annual return of 11.85% compared to just 8.01% for British stocks. Even Emerging and European Market equities yielded better returns than British equities.
The Vanguard 2022 Index Chart for UK market shows the returns of various asset classes from 1992 to 2021 . In addition, it shows the major world events and the periods of various British Prime ministers:
Click to enlarge
Source: Vanguard UK
Related ETF:
- iShares MSCI UK ETF (EWU)
Download in pdf format:
Disclosure: No Positions