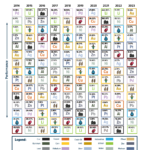
The equity investment returns of the G-20 countries based on their benchmark index from 2000 to 2020 is shown in the chart below in the order of performance. The returns noted are in US dollars and do not include dividends and fees.
Click to enlarge
Source: Quantalytica
Related EFTs:
- PowerShares India (PIN)
- SPDR S&P 500 ETF (SPY)
- iShares MSCI Mexico Capped Investable Market (EWW)
- iShares FTSE/Xinhua China 25 Index (FXI)
- iShares MSCI South Korea ETF (EWY)
- iShares MSCI Germany Index Fund (EWG)
- iShares MSCI Canada Index Fund (EWC)
- iShares MSCI Australia Index Fund (EWA)
- iShares MSCI United Kingdom Index (EWU)
Disclosure: No positions


