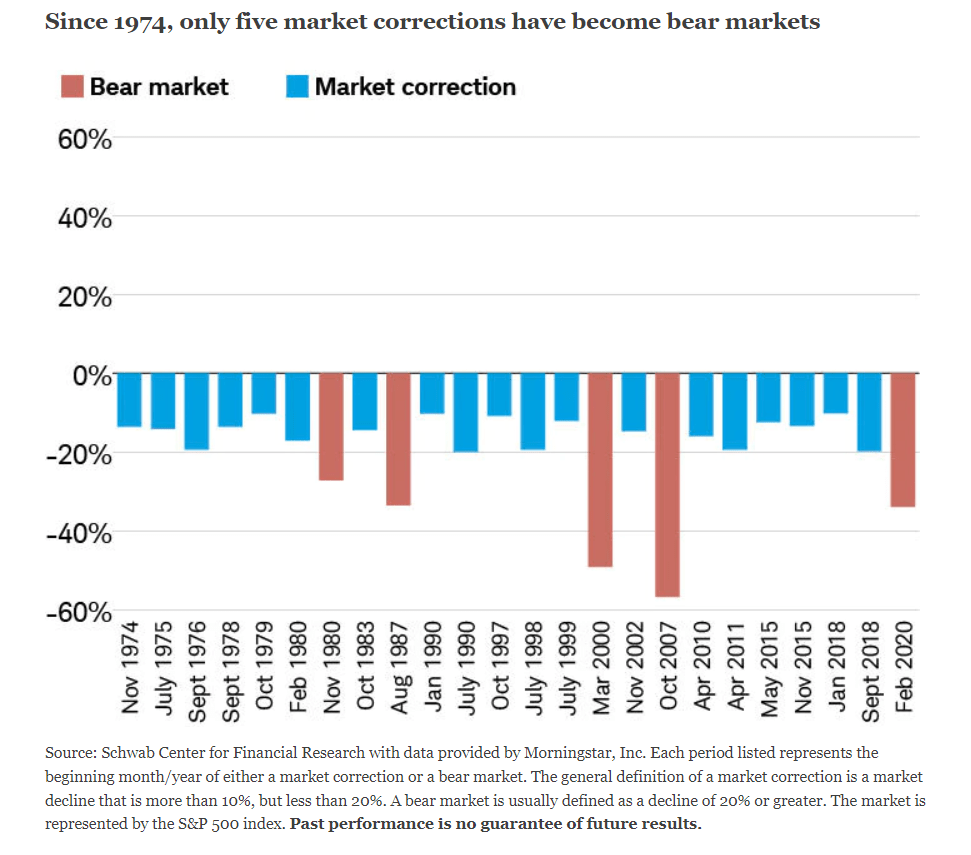
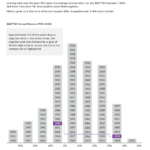
A correction is defined as a decline of 10% from recent market highs. Bear markets are market declines of 20% or more. Equity markets go through plenty of market corrections over the years. But very few of the corrections actually turn into bear markets.
The following chart shows that since 1974 there have been many corrections but only five turned into bear markets:
Click to enlarge
Source: Market Correction: What Does It Mean?, Schwab
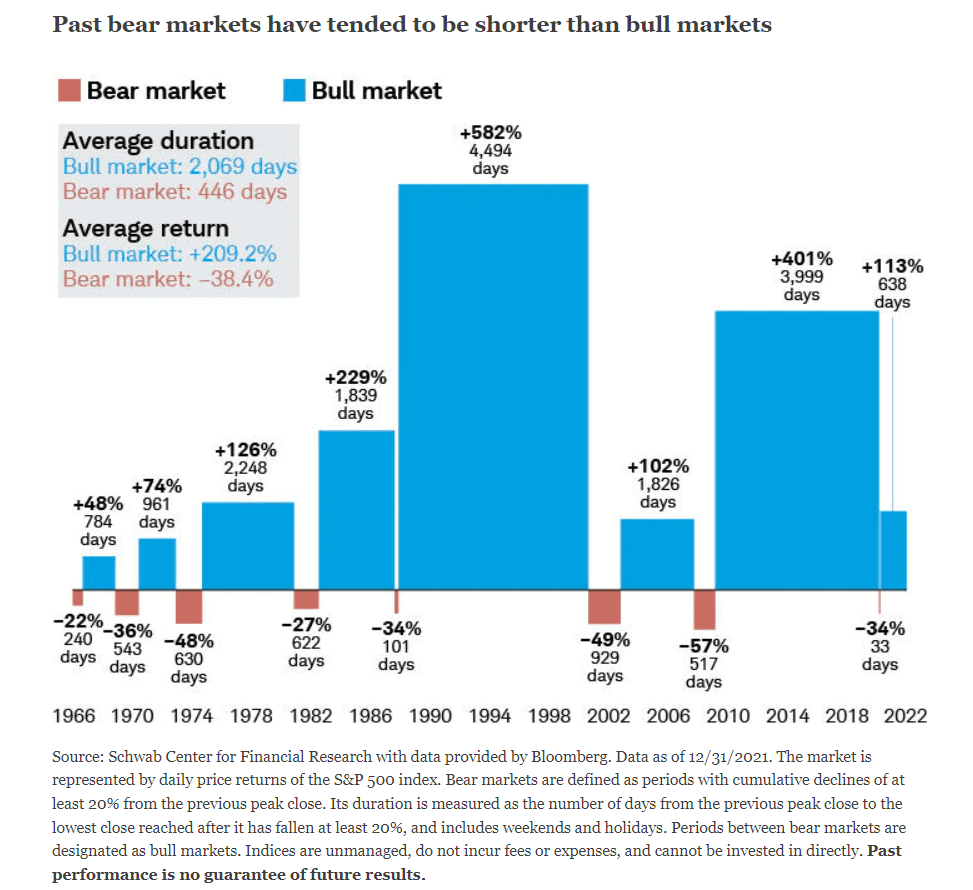
Another important factor to remember is bear markets tend to be shorter than bull markets. This is because stocks usually tend to go up over the long term.
Click to enlarge
Source: Market Correction: What Does It Mean?, Schwab
The key takeaway is that market corrections are normal and is a feature of equity markets. In fact, corrections can also be healthy as they tend to clear out speculators and other short-term traders. For long-term investors the trick for success with equity investing is to endure market corrections and avoid selling out in panic. Patient and smart investors in fact take advantage of corrections to add stocks at cheaper levels. Similarly investors that continue to hold through bear markets can recover the losses when markets eventually recover.
