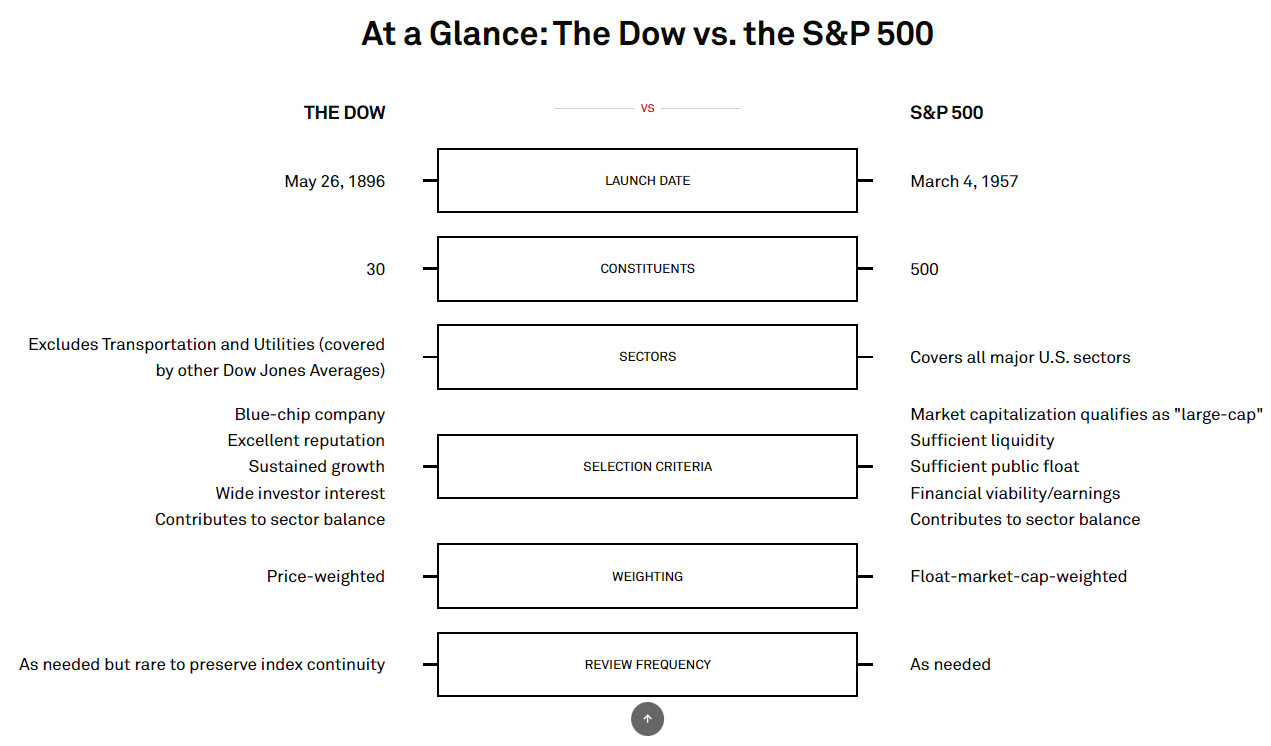
The two major benchmark indices of the US equity market are the Dow Jones Industrial Average, popularly known as the Dow Jones and the S&P 500. The Dow Jones is the oldest index founded in 1896 and is comprised of 30 blue-chip companies. The S&P 500 offers more depth and is more representative of the US economy. It contains 500 companies from a wide-variety of industries. According to S&P, the covers approximately 80% of available market capitalization. About $13.5 Trillion of assets was benchmarked against the S&P 500 at the end of 2020. With that brief intro below are the key six differences between the Dow and the S&P 500:
Click to enlarge
Source: S&P Global
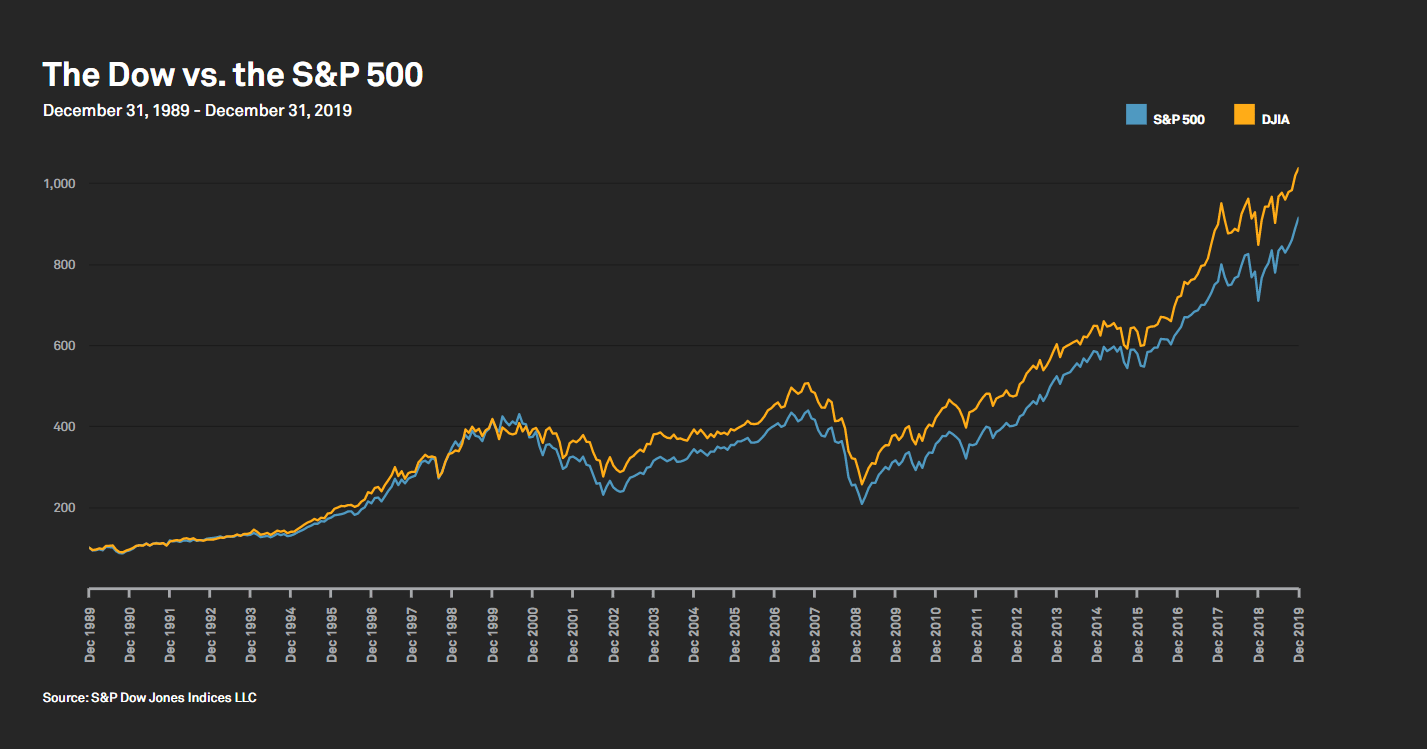
Though the indices differ in many ways, in terms of performance both the indices have tracked each other as shown in the chart below:
Click to enlarge
Source: S&P Global
So when following the equity markets, it does not matter which index one follows. However most people follow the S&P 500 for the reasons mentioned above.
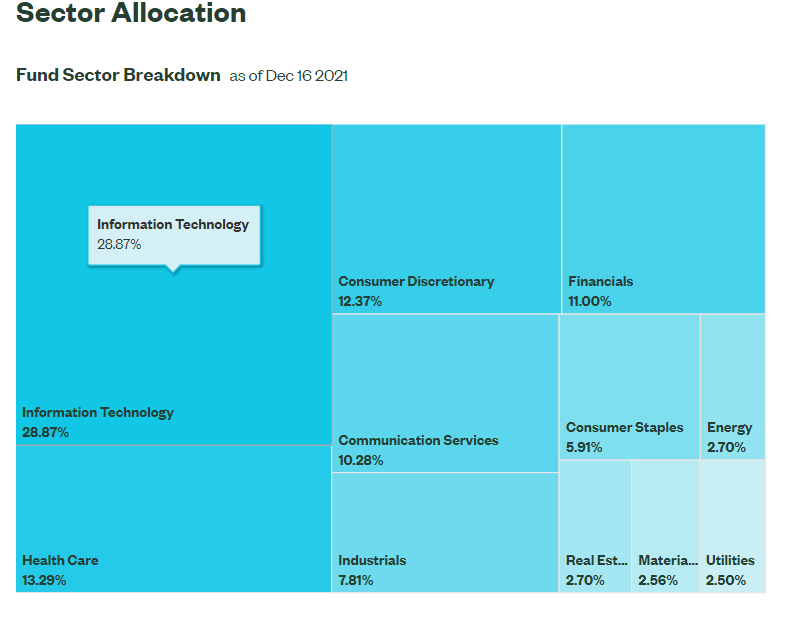
The top ETF that is benchmarked against the S&P 500 is the SPDR® S&P 500® ETF Trust (SPY). This massive ETF has an asset base of over $436 billion and the expense ratio is very small at 0.0945%. Since the ET mirrors the index, it has a major weighting in Information Technology as shown in the sector breakdown below:
Click to enlarge
Source: SSGA
The SPDR® Dow Jones® Industrial Average ETF Trust (DIA) tracks the Dow Index. The assets under management for this fund is over $29.0 billion. As most investors prefer the S&P 500, SPY is huge in size compared to DIA.
For investors that do not want to pick individual stocks, these two ETFs offer excellent alternatives to invest passively in the corresponding index.
Disclosure: No positions
