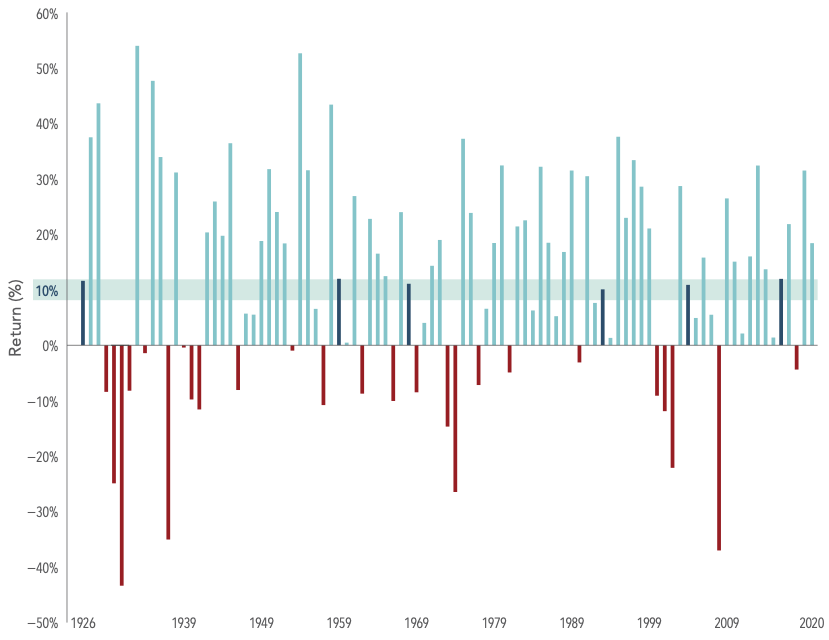
Stocks generally tend to perform well over the long-term. However in the short-term stocks can be volatile and extreme crashes are also possible. Since it is impossible to predict when the equity market soar or decline it is wise to be patient and hold investments over many years. The US equity market has had many up years than down years since 1926 as shown in the chart below:
Click to enlarge
Past performance is no guarantee of future results. Actual returns may be lower. Investing risks include loss of principal and fluctuating value. There is no guarantee an investment strategy will be successful. Indices are not available for direct investment. Index returns are not representative of actual portfolios and do not reflect costs and fees associated with an actual investment. In US dollars. S&P data © 2021 S&P Dow Jones Indices LLC, a division of S&P Global. All rights reserved. Dimensional Fund Advisors LP is an investment advisor registered with the Securities and Exchange Commission.
Source: The Bumpy Road to the Market’s Long-Term Average, Madden Funds
From 1926 to 2020, in just six years the average annual return came close the long-term average of 10%. Yearly returns have reached as high as 54% while yearly declines have been as low as 43%. So markets tend to go the extreme on either direction.
As mentioned earlier, the good news is the market has been up 70 times and down only 25 times since 1926.
The key takeaway is investors should not worry about one day or one week or one year declines. Instead they should keep their focus on achieving the long-term goal of earning a better return with equities than other investment options.
Related ETF:
- SPDR S&P 500 ETF (SPY)
Disclosure: No positions


