Vanguard Australia has published the 2021 Vanguard Index Chart. This powerful chart shows the importance of long-term investing and the benefits of diversification over various asset classes. In the long run, US stocks beat Australian stocks and other investment types. An A$10K investment on July 1, 1991 would have grown to over A$217K if invested in US stocks. That equals to about 10.8% per year. Australian stocks earned 9.7% per year over the same period. An investor that simply kept the money in a bank would have seen the initial A$10K grow to just about A$39K.
The chart also shows the leadership changes in the US and Australia since 1991 and major events such as the Global Financial Crisis(GFC), Brexit, etc.
The following chart from showing the returns of various asset classes from July 1991 to June 2021 for the Australian market:
Click to enlarge
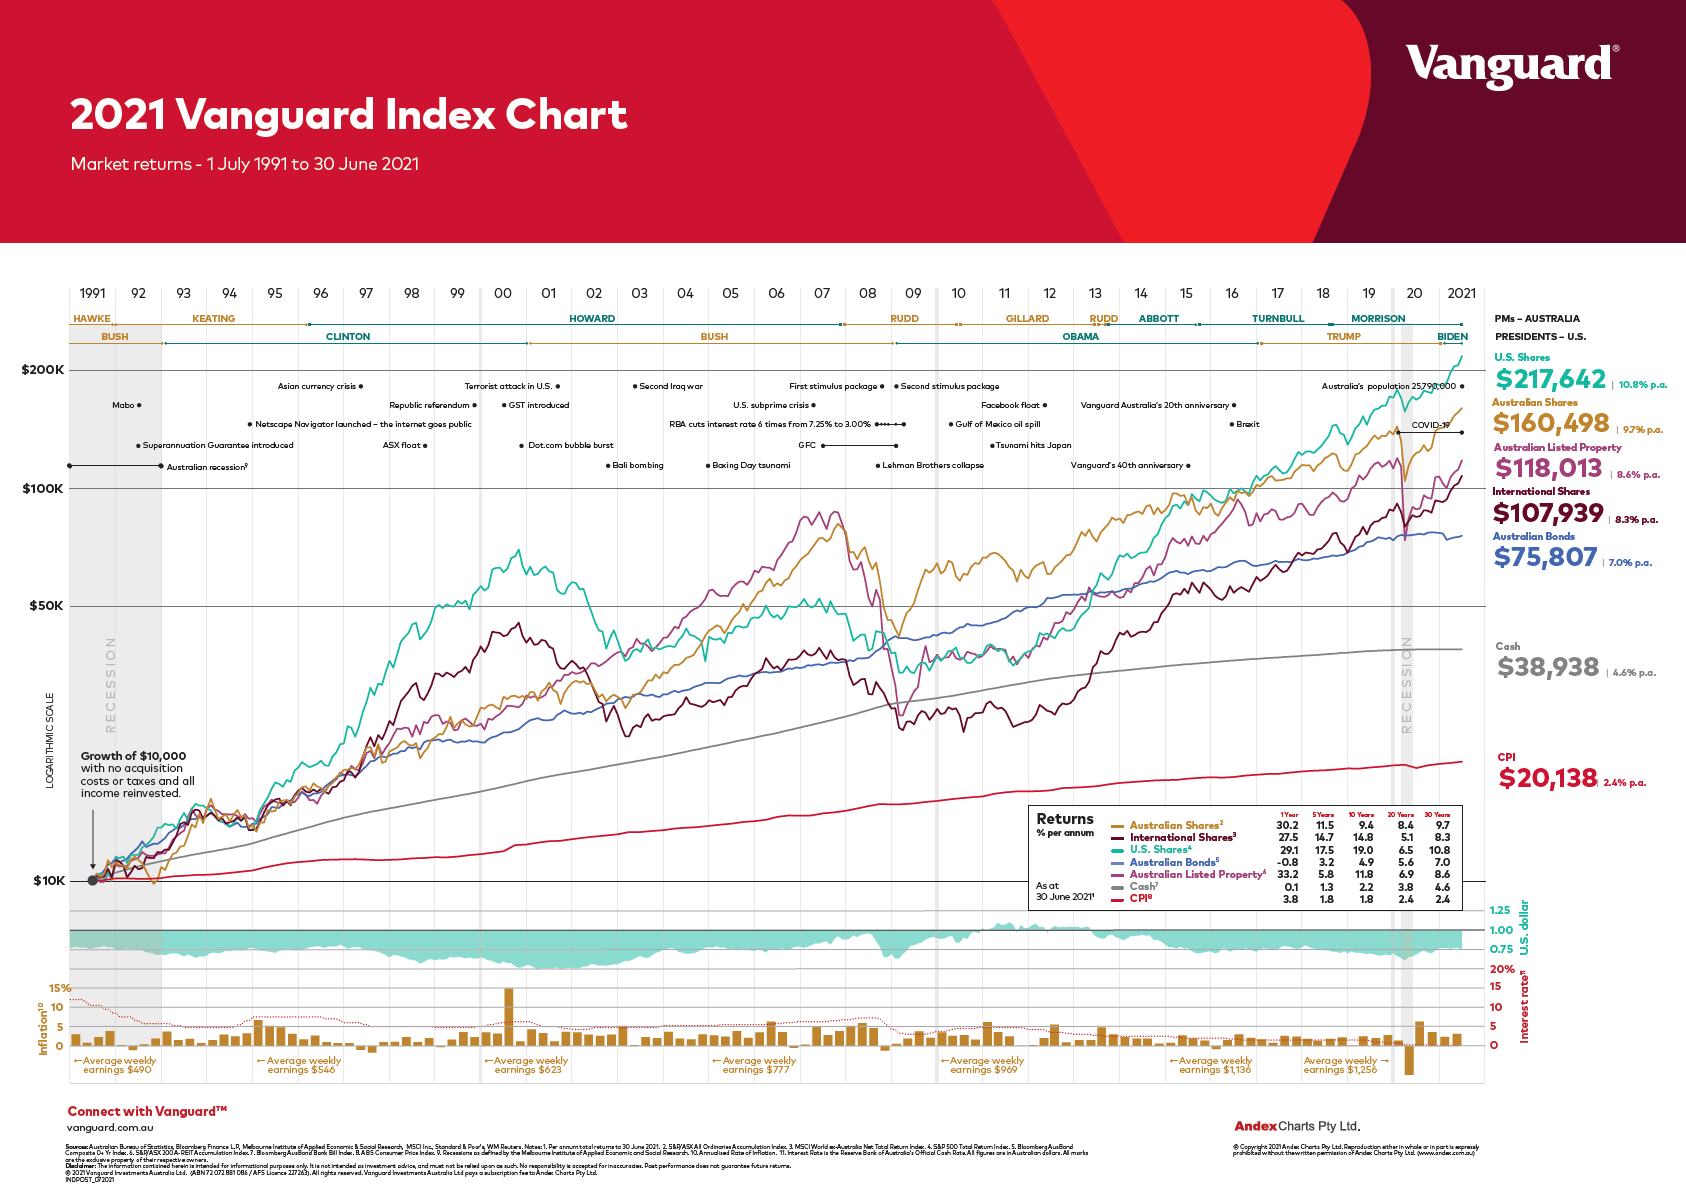
Note: The dollar figures shown above are in Australian dollars
Source: Vanguard Australia
Related ETF:
- iShares MSCI Australia ETF (EWA)
Earlier:
Disclosure: No Positions