Diversification and investing for the long-term are the key ingredients for success in equity investing. I found the following chart from Vanguard showing the returns of various assets over the long-term (from June-1989 to June-2019) in the context of the Australian market:
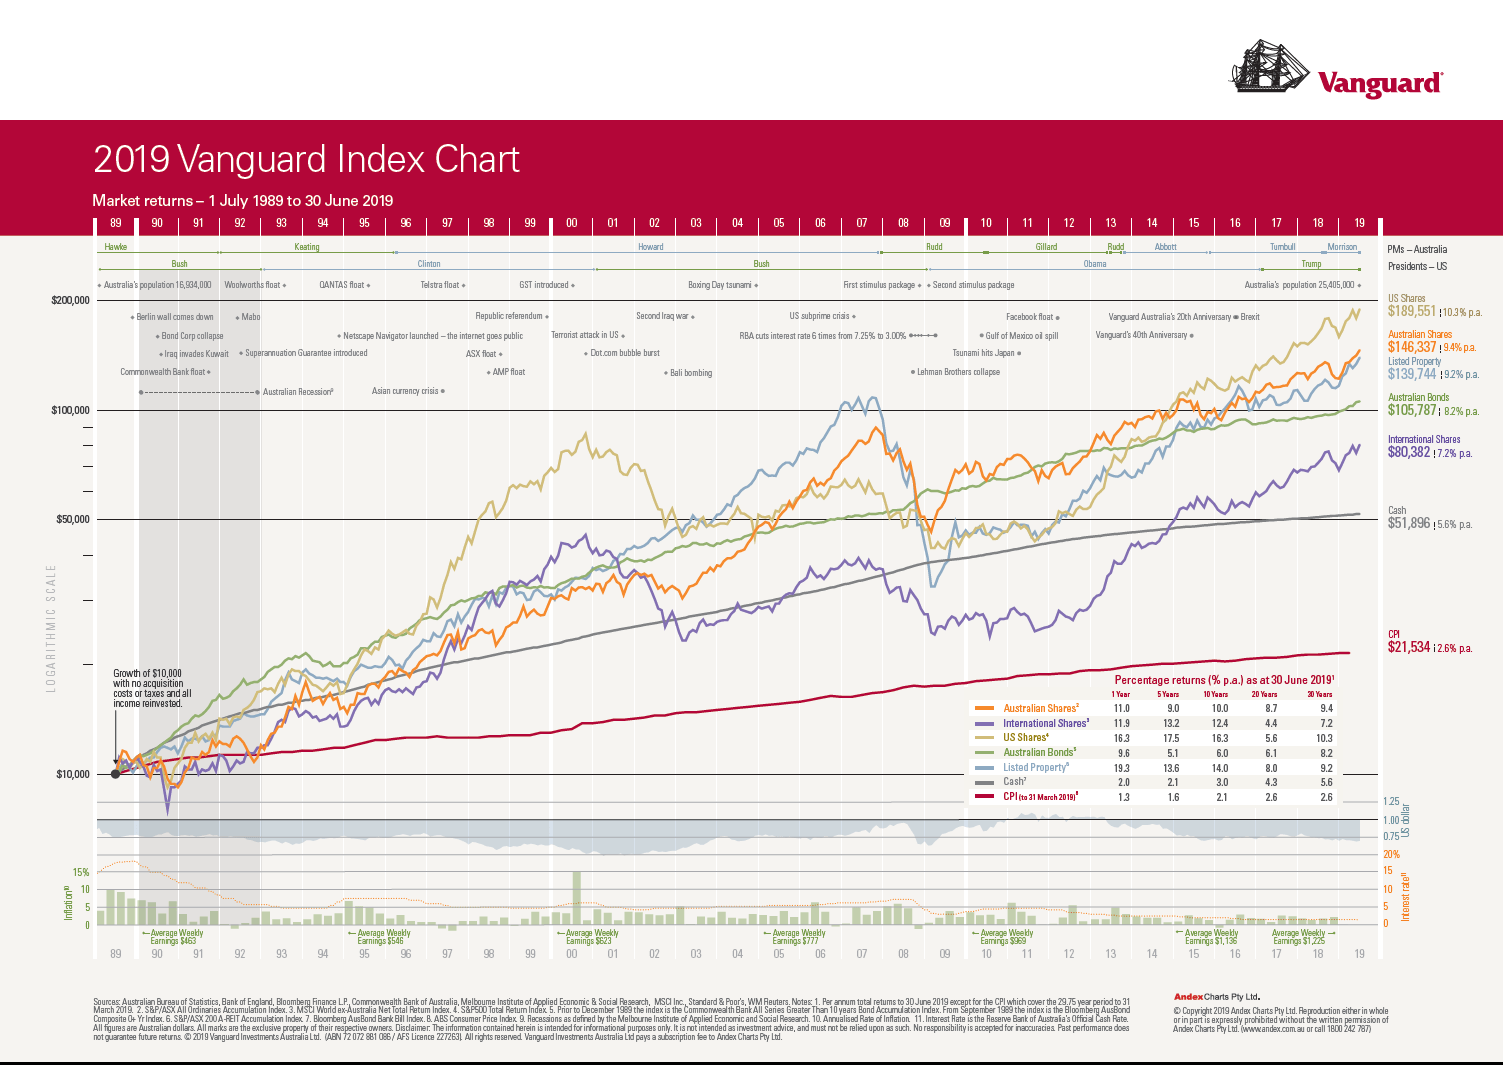
The 2019 Vanguard Index Chart:
Click to enlarge
Financial Year Total Returns of Major Asset Classes:
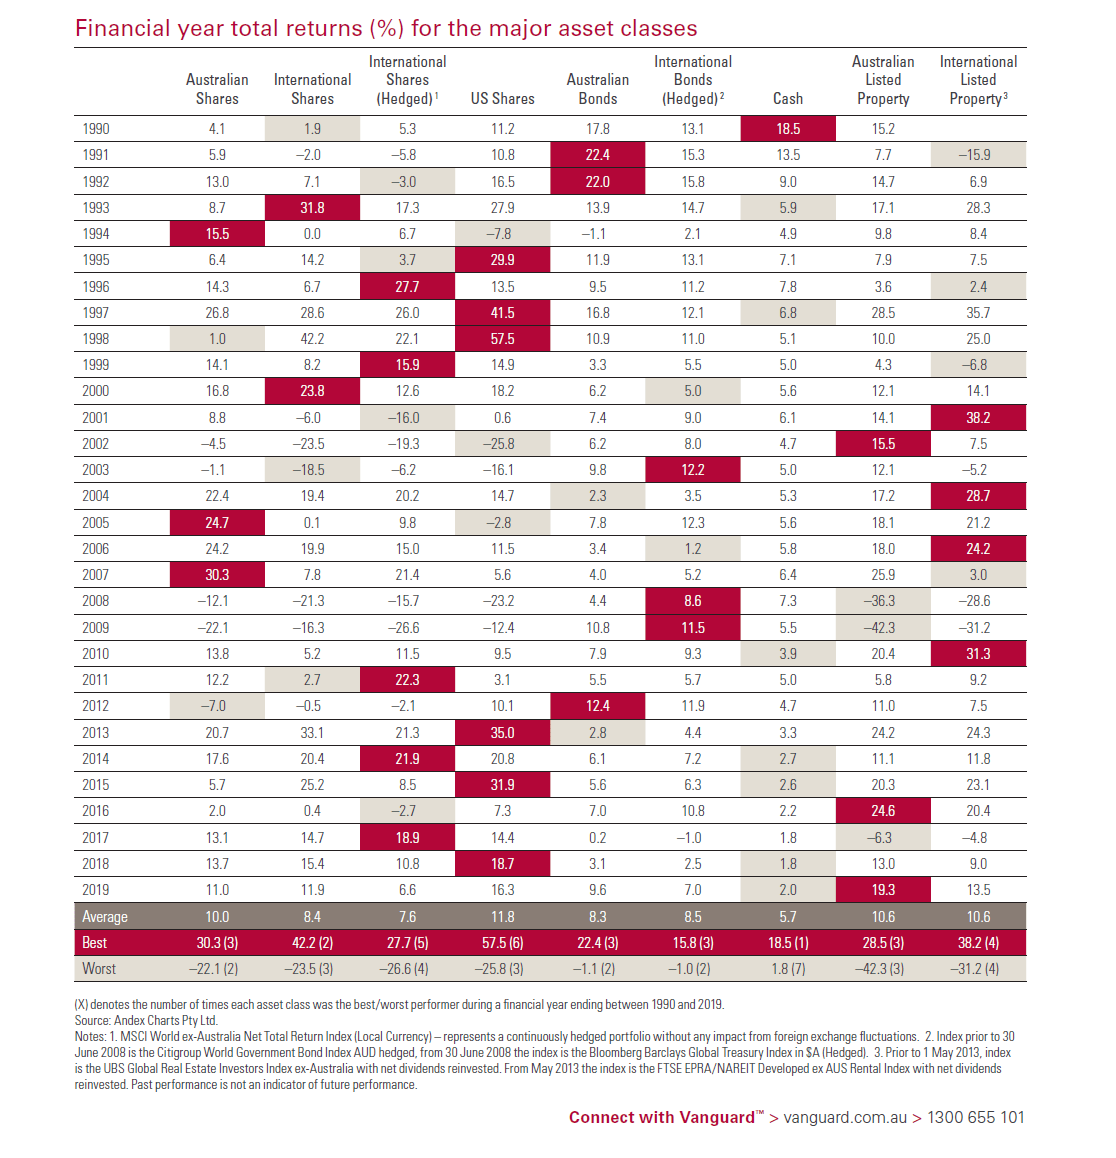
Source: Stay the course – 2019 Vanguard Index Chart, Vanguard Australia
The above chart also shows some of the key economic and political events.
The key takeaway is that US shares were the top performers over the 30-year period followed by Aussie stocks. Cash yielded the lowest return during the same period.