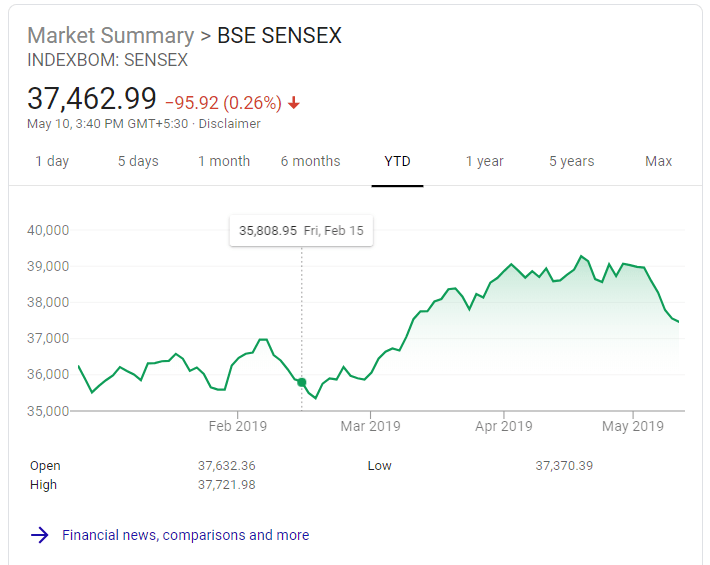
The BSE S&P/SENSEX index of the Indian equity market reached an all-time high of over 39,000 in April. Since then it has drifted downwards and closed at 37,462 on Friday. The market is highly anticipating the results of the General Elections currently in progress. The election was held in multiple phases and after the final phase, votes will be counted on May 23rd and results will be announced the same day. The current Prime Minister Modi has a pretty good chance of winning as the opposition Congress party is disarray without a charismatic leader and vision. Either way global investors are keeping a watchful eye on Indian equities as election results day is fast approaching.
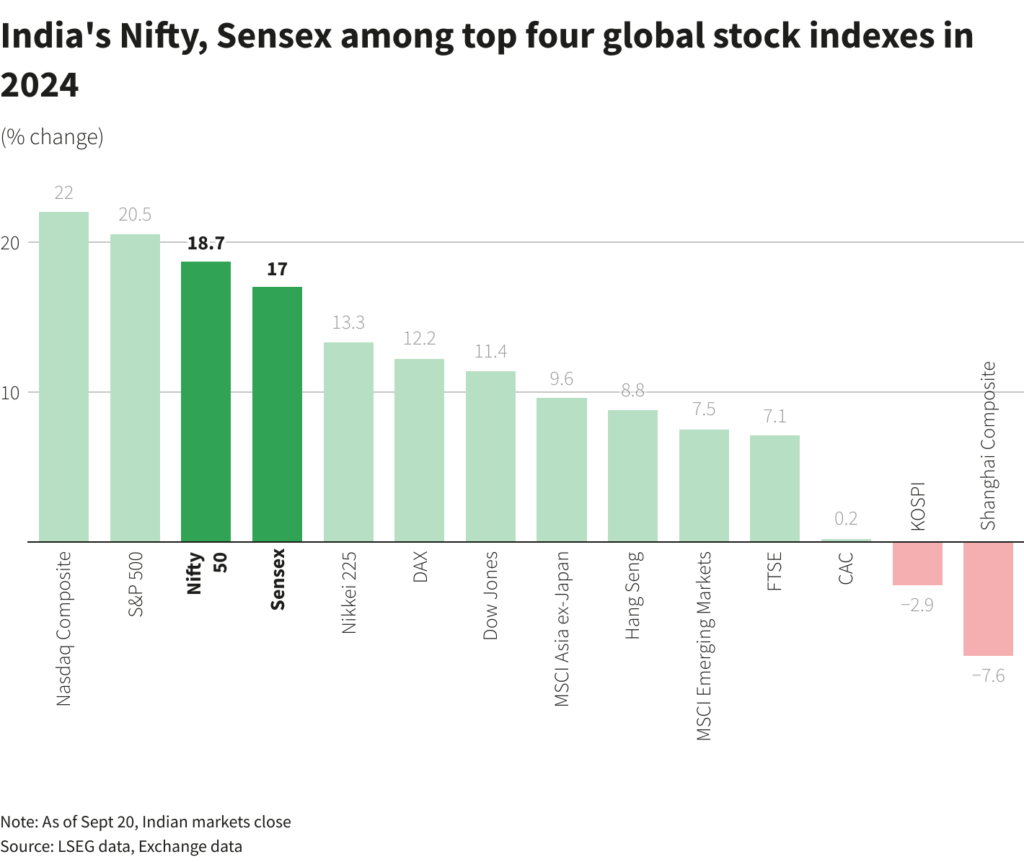
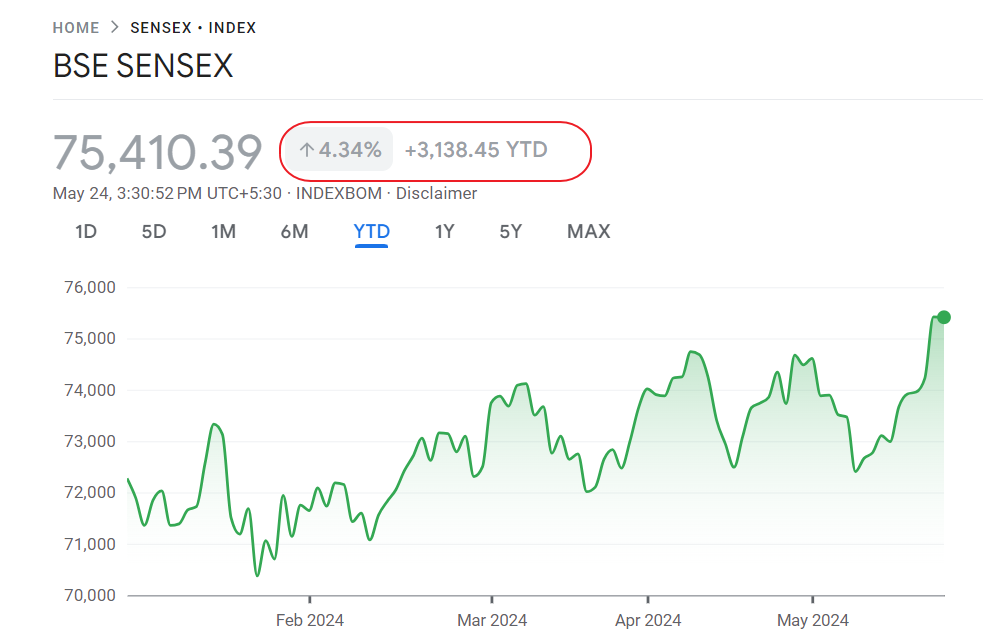
The below charts show the performance of the Sensex year-to-date and 5 year period.
Sensex return – YTD:
Click to enlarge
Sensex return – 5 Years:
Source: Google Finance
The complete list of India ADRs trading on the US markets can be found here.
The complete list of India ETFs trading on the US markets can be found here.


