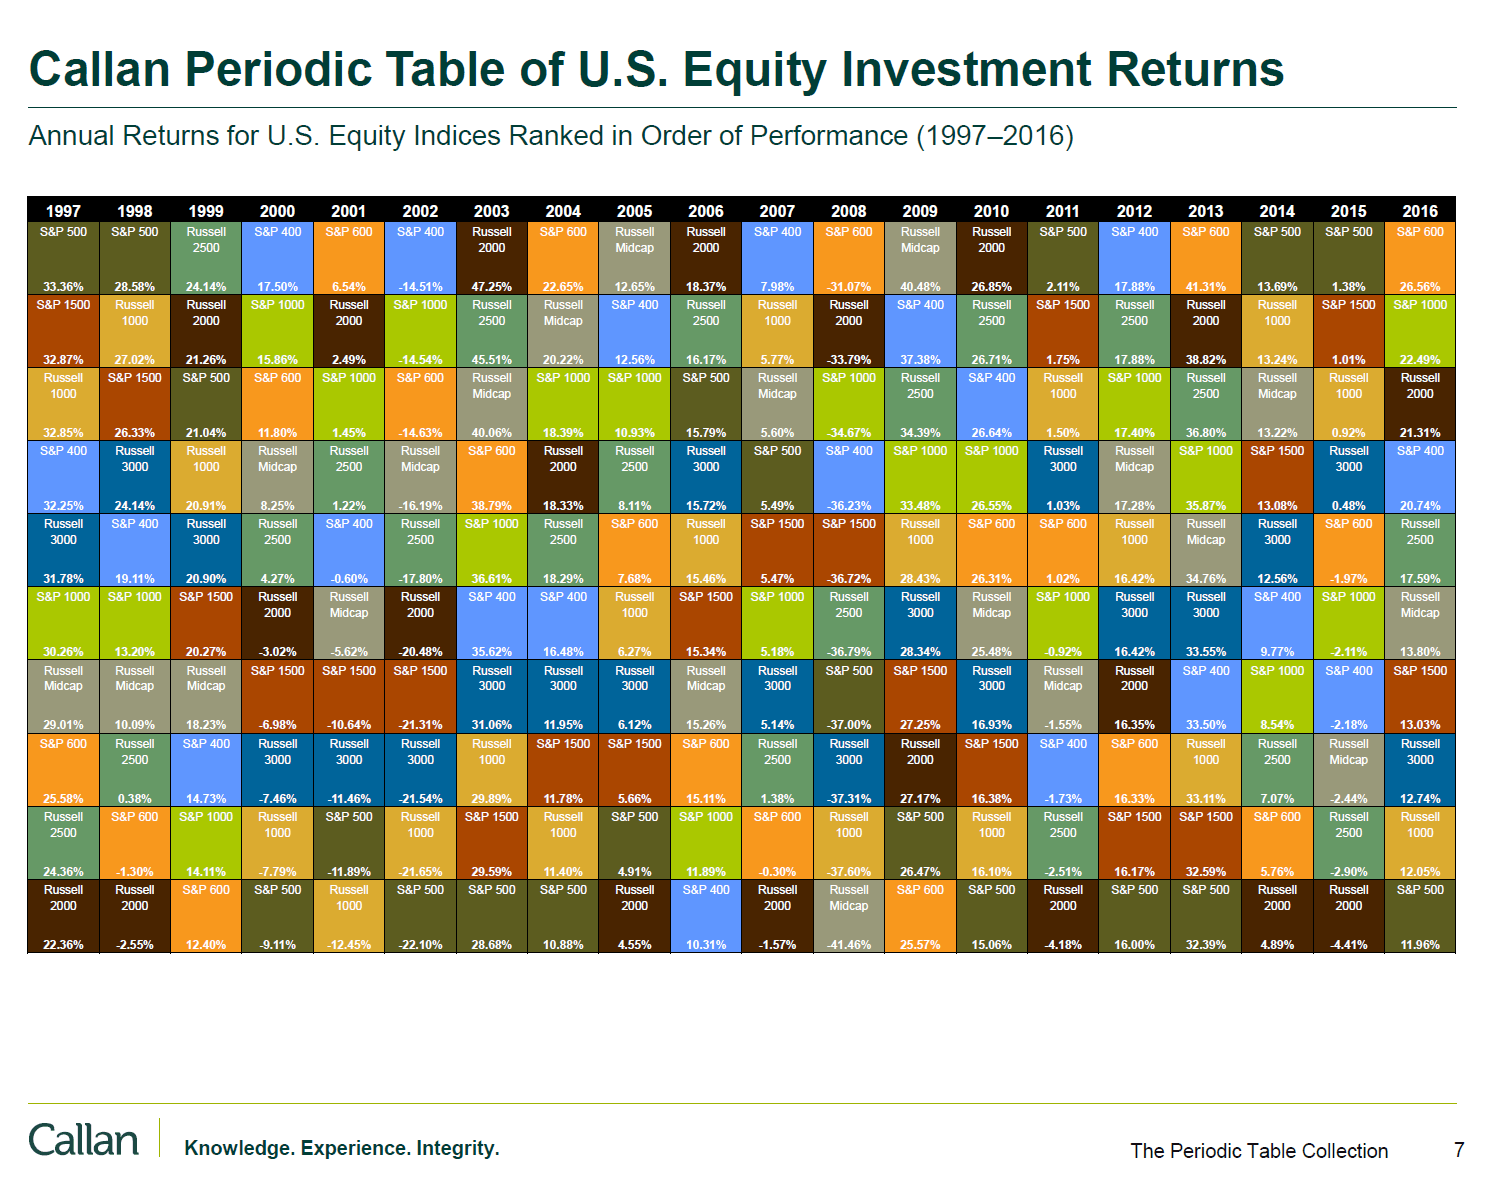
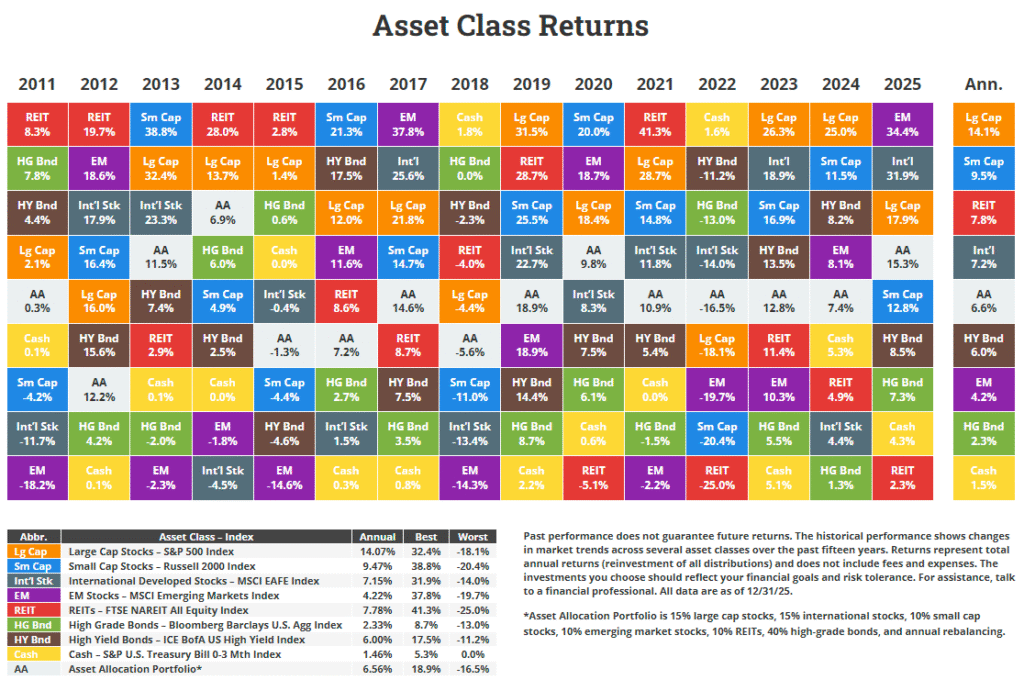
In earlier posts we saw the Callan Periodic Table of Investment Returns for key indices, global equity indices and the famous annual periodic table for 2017. Below is the chart for US equity investment returns for the period 1997-2016:
Click to enlarge
Source: Callan Associates
The above chart shows the benefits of diversification between various equity types. The gap in returns between the small, mid and large caps is some years is substantial.
Download: The Callan Periodic Table of Investment Returns 1998-2017 (in pdf)
