The FTSE 100 Index is the benchmark index of the UK equity market. It contains 100 companies with the highest market capitalization.
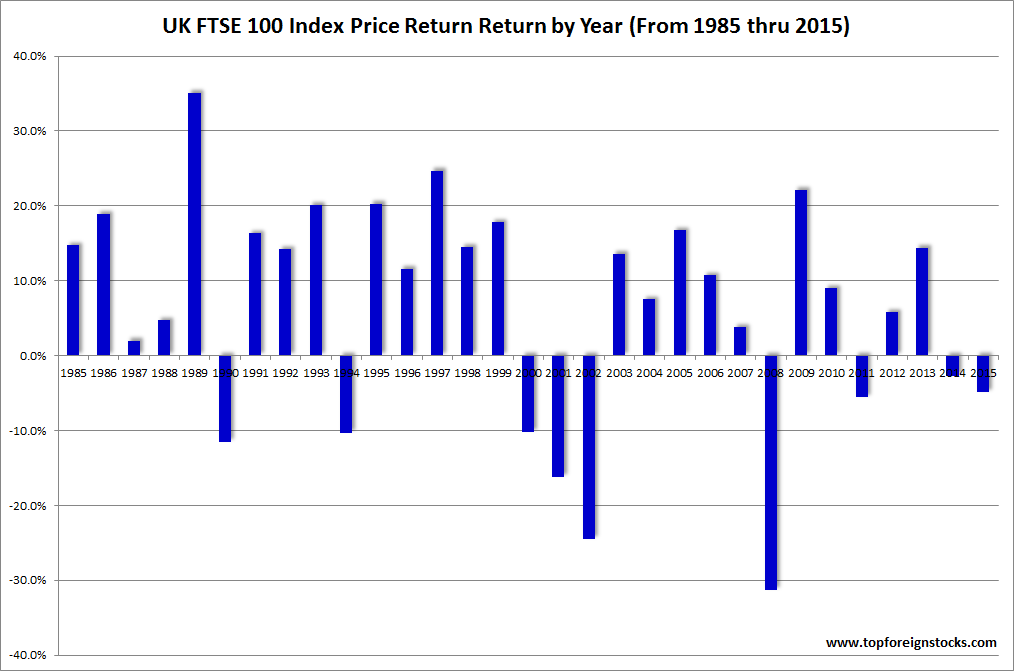
The FTSE 100 Index Returns By Year from 1985 thru 2015 are shown in the chart below:
Click to enlarge
The FTSE 100 Index Returns By Year from 1985 thru 2015 are shown in the table below:
| Year | UK FTSE 100 Index Price Return |
|---|---|
| 1985 | 14.7% |
| 1986 | 18.9% |
| 1987 | 2.0% |
| 1988 | 4.7% |
| 1989 | 35.1% |
| 1990 | -11.5% |
| 1991 | 16.3% |
| 1992 | 14.2% |
| 1993 | 20.1% |
| 1994 | -10.3% |
| 1995 | 20.3% |
| 1996 | 11.6% |
| 1997 | 24.7% |
| 1998 | 14.5% |
| 1999 | 17.8% |
| 2000 | -10.2% |
| 2001 | -16.2% |
| 2002 | -24.5% |
| 2003 | 13.6% |
| 2004 | 7.5% |
| 2005 | 16.7% |
| 2006 | 10.7% |
| 2007 | 3.8% |
| 2008 | -31.3% |
| 2009 | 22.1% |
| 2010 | 9.0% |
| 2011 | -5.6% |
| 2012 | 5.8% |
| 2013 | 14.4% |
| 2014 | -2.7% |
| 2015 | -4.9% |
Data Source: FTSE Indices since 1985, Swanlowpark
Download Data:
Related ETF:
- iShares MSCI United Kingdom ETF (EWU)
Disclosure: No Positions
