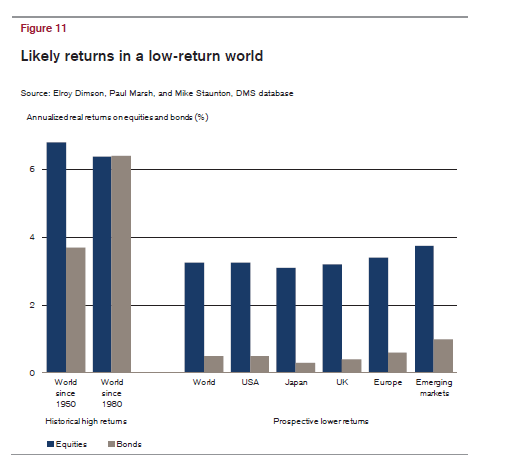
Every year Credit Suisse publishes their famous Global Investment Returns Yearbook. This year’s version was released in February. As usual this year’s report include a ton of fascinating charts and data. Here is one chart:
Click to enlarge
Figure 11 highlights the contrast with the past. The two sets of bars on the left are taken from Figure 1 and represent historical annualized real returns since 1950 and 1980 – the high-returns world. The bars on the right represent our estimates of the expected real returns on equities and bonds over the next generation. The bond returns are based on current yields, while the equity returns are based on expected cash returns plus an annualized equity premium that averages 3½%,but which varies with the systematic risk of each country/region.
Download the full report in pdf click on the image below:
Past Versions:
Credit Suisse Global Investment Returns Yearbook 2012
Credit Suisse Global Investment Returns Yearbook 2011


