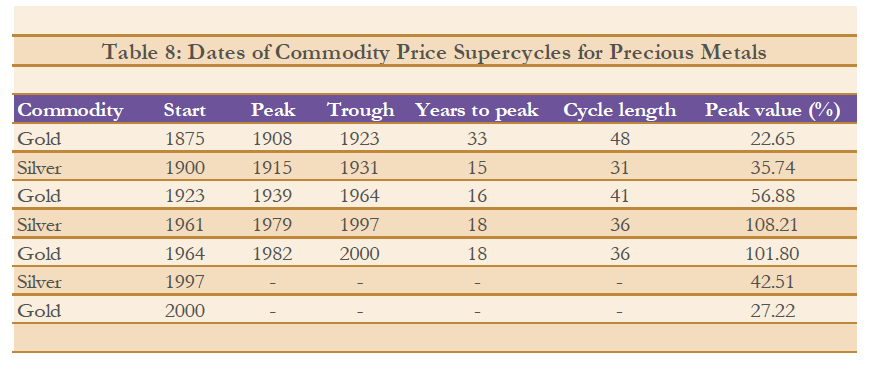
Commodity prices including those of precious metals tend to go through super-cycles. Booms and busts occur as a result of these cycles. These cycles last for many years.
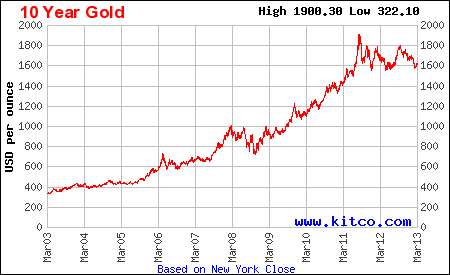
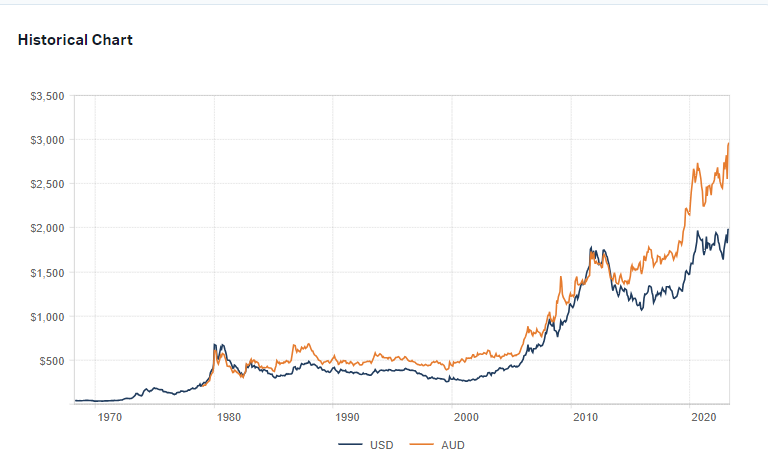
In the latest super-cycle gold prices have climbed consistently in the last decade up until 2011 when prices reached a peak of just over $1,900.00. Since then prices have been volatile. On Friday it closed at $1,609.20 in New York.
10-year gold price chart:
Click to enlarge
Source: Kitco
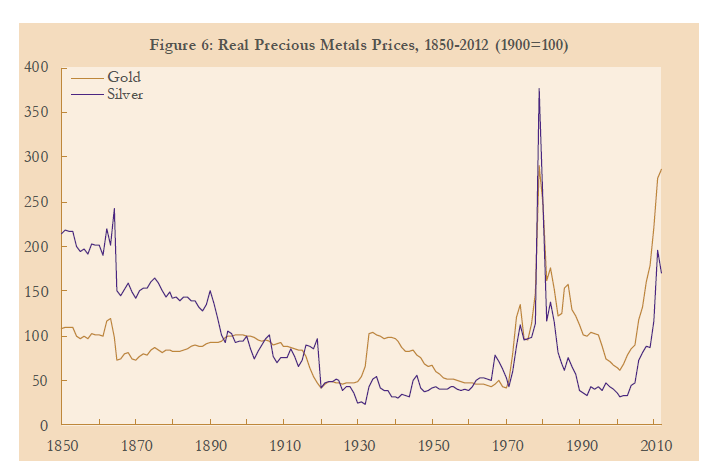
The following chart shows real gold and silver prices from 1850 to 2012:
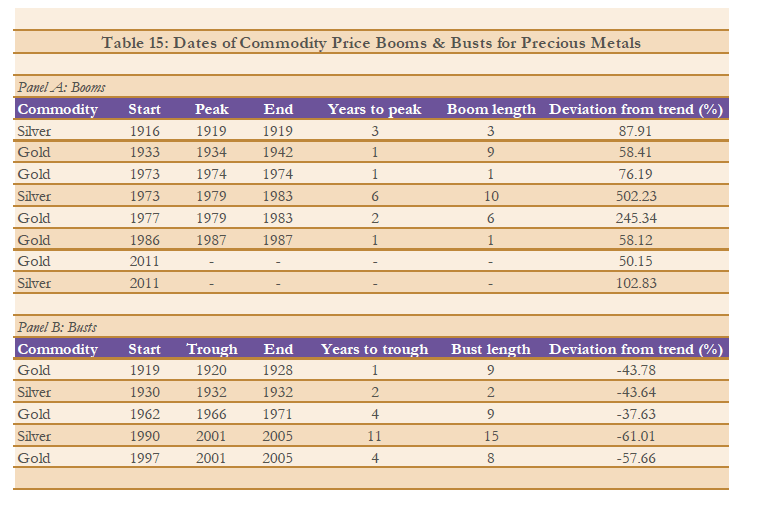
The tables below shows the dates of super-cycles and dates of booms and busts:
It is interesting to note the boom and bust lengths for these two precious metals. During the depression of the 1930s gold had one of the long boom periods. The recent long boom lasted 6 years from 1977 thru 1983.
Source:
FROM BOOM TO BUST: A TYPOLOGY OF REAL COMMODITY PRICES IN THE LONG RUN
by David S Jacks, Department of Economics, Simon Fraser University, Canada
NBER Working Paper No. 18874, March 2013
Related ETFs:
Disclosure: No Positions
