The Dow Jones Industrial Average closed at a record 14,329.49 yesterday. The S&P 500 closed at 1,544.26. With the Dow breaking past the previous record high some investors are wondering if this bull run is sustainable and how high the markets will go. The media is filled with stories of all types of forecasters and pundits predicting the continued upward trajectory of the stock market.
Here is James K. Glassman , executive director of the George W. Bush Institute with this Dow 36,000 article in Bloomberg:
The Dow Jones Industrial Average set a record this week, but it’s still far from the mark that economist Kevin Hassett and I forecast in our 1999 book, “Dow 36,000.”
We wrote in the introduction that “it is impossible to predict how long it will take” to get to 36,000. Then, in the same paragraph, we rashly made a guess anyway: “between three and five years.”
Today, the far edge of that time frame is clearly in reach. From its low of 6,547 on March 9, 2009, the Dow has risen 117 percent. Another 117 percent in four years would put it at 31,022, just 16 percentage points shy of the magic number.
Mr.Glassman prediction in 1999 did not come true but now states that the Dow may reach over 31,000 in just four years based on some wild assumptions. However a much closer figure from current levels is Dow 20,000.
When will the Dow reach the next psychologically-important milestone of 20,000?
Certainly I do not know the answer. There are too many variables to consider especially when some are voicing concerns over the irrational exuberance of investors and questioning if the current stock prices are warranted given the weak macroeconomic conditions.
Last August, Seth J. Masters, Chief Investment Officer for Asset Allocation at AllianceBernstein and Chief Investment Officer of Bernstein Global Wealth Management wrote a fascinating article providing a possible answer to my question above. From the article:
The models we use when investing are complex, but a simple argument makes the point. The expected return for a Treasury bond held to maturity is equal to its yield. Similarly, the expected return for a stock equals its earnings per share (EPS) divided by its price—its earnings yield—if the company has no growth prospects and therefore returns all of its earnings to shareholders. If the company does have growth prospects, it would retain some of its earnings to fund growth. In that case, the expected return equals the dividend yield plus dividend growth. If the company pays out a constant share of earnings as dividends, dividend growth equals earnings growth.
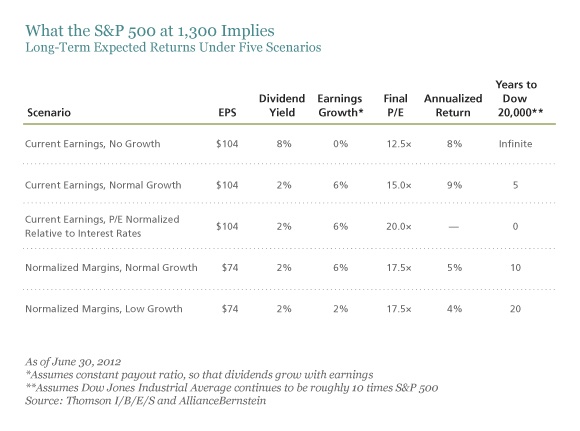
Let’s apply this framework to the S&P 500 Index’s price level of about 1,300. Consensus forecasts call for the index to have $104 in earnings per share this year. If the companies in the index didn’t expect any growth, they would pay out all their earnings as dividends, and earnings and dividends wouldn’t grow. The S&P 500’s dividend yield would be 8%, as the first row of the display below shows.
Click to enlarge
Source: The Fundamental Case for the 20,000 Dow, August 13, 2012, The AllianceBernstein Blog on Investing
The chart shows the number of years for the Dow to reach 20,000 based on five different scenarios. It would be interesting to see how the Dow performs in the next few years.
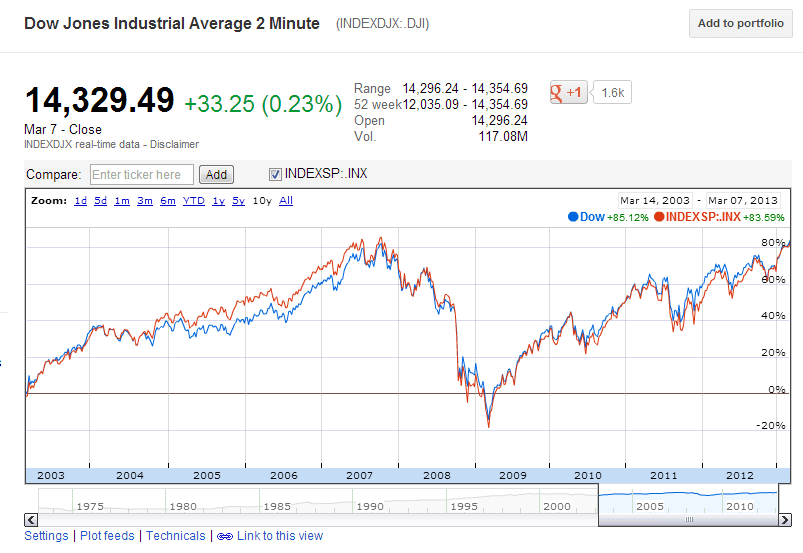
The chart below shows the 10-year return of Dow and S&P 500:
Source: Google Finance
Clearly both the Dow and the S&P have had an astonishing recovery from the lows of the global financial crisis.
Related ETFs:
Disclosure: No Positions


