Originally I had scheduled the article below for posting on next Friday. After reading yesterday’s The New York Times editorial on Occupy Wall Street protests I decided to publish it today.
From the Times editorial:
Extreme inequality is the hallmark of a dysfunctional economy, dominated by a financial sector that is driven as much by speculation, gouging and government backing as by productive investment.
When the protesters say they represent 99 percent of Americans, they are referring to the concentration of income in today’s deeply unequal society. Before the recession, the share of income held by those in the top 1 percent of households was 23.5 percent, the highest since 1928 and more than double the 10 percent level of the late 1970s.
That share declined slightly as financial markets tanked in 2008, and updated data is not yet available, but inequality has almost certainly resurged. In the last few years, for instance, corporate profits (which flow largely to the wealthy) have reached their highest level as a share of the economy since 1950, while worker pay as a share of the economy is at its lowest point since the mid-1950s.
Income gains at the top would not be as worrisome as they are if the middle class and the poor were also gaining. But working-age households saw their real income decline in the first decade of this century. The recession and its aftermath have only accelerated the decline.
Research shows that such extreme inequality correlates to a host of ills, including lower levels of educational attainment, poorer health and less public investment. It also skews political power, because policy almost invariably reflects the views of upper-income Americans versus those of lower-income Americans.
Original Article:
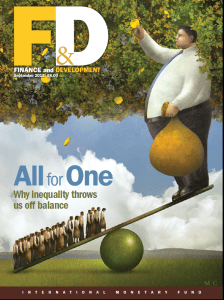 The latest edition of IMF’s Finance & Development magazine is mainly focuses on Income Inequality and its impacts. One can gain a wealth of knowledge from reading many of the articles related to this topic in this excellent issue.
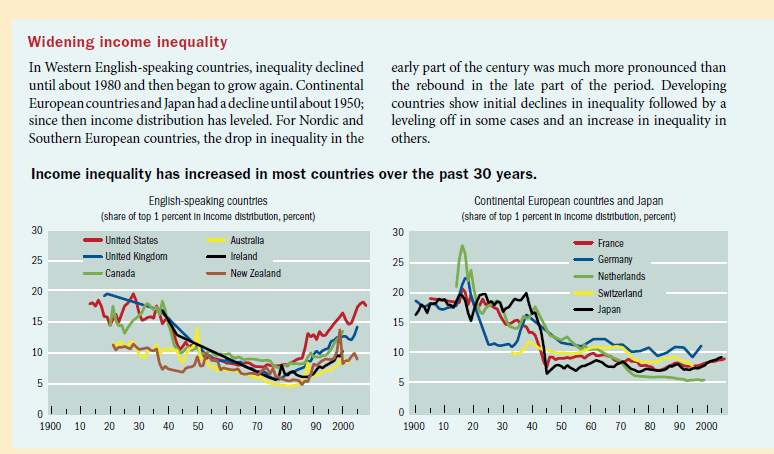
Income inequality declined in the first half of the 20th century. But it is making a comeback in most of the countries around the world. This is especially striking in the case of developed world where income inequality has increased in the past 30 years.
Click to enlarge
In the beginning of the 20th century, the top 1 percent of earners were capital owners. But by the end of the century the hired hands – the top executives of corporations – shared the biggest share of the income distribution with capital owners. In this U.S., this setup continues to worsen as shown in the chart below:
Unlike some of the original capitalists like J.P. Morgan, David Rockefeller or Andrew Carnegie, today’s top executives do not invest their own capital and take huge risks to accumulate the outsized rewards. Instead fabulous wealth are legally transferred from companies to the pockets of these executives on a daily basis supposedly for their magical talent. Some examples of this modern-day “capitalists” with outlandish compensation in 2010 include Philippe P. Dauman of Viacom with $84.5 million, Ray R.Irani of Occidental Petroleum with $76.1 million, Lawrence J.Ellison of Oracle with $70.1 million, etc. (Source: The Pay at the Top, New York Times).
Update: Yesterday Bank of America (BAC), the Too-Big-To-Fail bank that still survives, announced that it will pay Sallie L. Krawcheck, the fired wealth-management division head a sum of $6 million. This latest scam case illustrates how the same banks that triggered the credit crisis and were bailed out by the state have not learned a single thing from their own near-death experience.
From the F&D article Inequality over the Past Century:
The dramatic increase in recent decades in the share of income going to the top 1 percent in many countries is due to a partial restoration of capital incomes and, more significantly, to very large increases in compensation for top executives. In the United States, as a result, the working rich have joined capital owners at the top of the income hierarchy.
In the United States, average real incomes grew at a 1.3 percent annual rate between 1993 and 2008. But if the top 1 percent is excluded, average real income growth is almost halved, to about 0.75 percent a year. Incomes of the top 1 percent grew 3.9 percent a year, capturing more than half of the overall economic growth experienced between 1993 and 2008. During the expansions of 1993–2000 and 2001–07, the income of the top 1 percent grew far more quickly— at an annual rate of more than 10.3 percent and 10.1 percent, respectively—than that of the bottom 99 percent, whose incomes grew at a 2.7 percent annual rate in the earlier expansion and 1.3 percent in the later one.
What is Kuznets Curve?
The Kuznets curve, formulated by Simon Kuznets in the mid-1950s, argues that in preindustrial societies, almost everybody is equally poor so inequality is low. Inequality then rises as people move from low-productivity agriculture to the more productive industrial sector, where average income is higher and wages are less uniform. But as a society matures and becomes richer, the urban-rural gap is reduced and old-age pensions, unemployment benefits, and other social transfers lower inequality. So the Kuznets curve resembles an upside-down “U.”
Based on the Kuznets curve theory also “the United States—the richest large country in the world—is one paradigmatic case of rising inequality” according to another article in the magazine. As China’s economy was liberalized in 1978, inequality surged and eventually surpasses that of the U.S. as shown in the chart below:
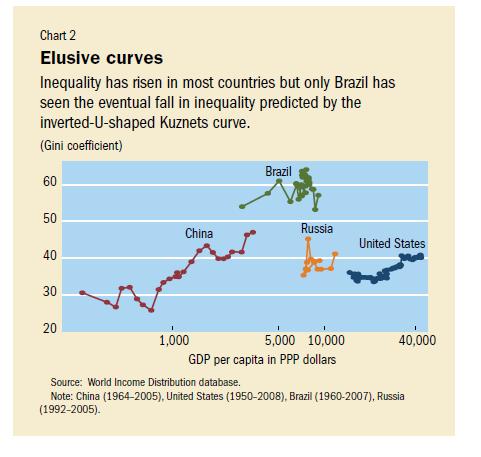 Source: Finance & Development, September 2011, IMF
Disclosure: No positions
