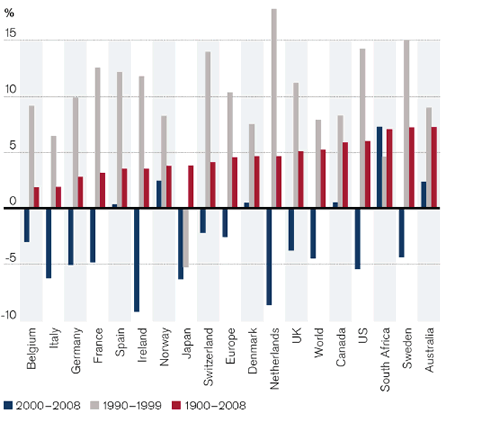
The chart below shows the performance of equity markets of select countries over the long-term and in the past 20 years:
Source: Credit Suisse via Equinox of South Africa
In the long-term (1900-2008) shown in red color bar, the stock market returns of the countries shown above ranged from 1.5% to 6.5%. The grey bar shows the return during the dot com/technology boom period from 1990 to 1999. During this bull market period, most markets outperformed their long-term averages and had returns that exceeded 15%.
The most recent period from 2000 to 2008 is denoted by the blue bar.During this period, only S had positive returns. South Africa was the top performer yielding over 7%. The worst performers in this timeline were Italy, Ireland, Japan, The Netherlands and the USA.
Source: Kokkie Kooyman: Now is the time to invest in developed-country banksÂ


