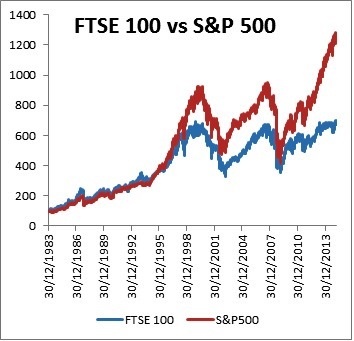
The FTSE 100 Index closed at 7,022 yesterday. It has taken UK’s benchmark index to cross the 7,000 level. Almost 17 years ago the FTSE first reached 6,000. Though the index has reached a milestone, the performance is not that great compared to the S&P 500. U.S. stock have outperformed the FTSE 100 by a wide margin in the past five years as shown in the chart below:
Data Source: Datastream from 19.3.10 to 19.3.15, total returns in local currency terms.
Source: Why no-one should be celebrating 7,000 on the FTSE 100 by Tom Stevenson, Fidelity UK
From the article:
The numbers are quite startling. Between 1984 and the day in 1998 when the FTSE 100 exceeded 6,000 for the first time, the 500% rise in the UK market was bettered by the US but not massively so. Over that same period, the S&P 500 rose by 572%.
Since 1998, however, the total return since 1984 has risen to only 596% for the FTSE 100 but to a massive 1,127% for the S&P 500. We look like New York’s country cousins today.
This is surprising when you consider how global markets move, on a day to day basis, in lockstep. A bad day on Wall Street is invariably a bad day in the City too and vice versa.
The reason for the long-term divergence is simple enough to understand, though. It reflects the different make-up of the two markets. The FTSE 100 is increasingly neither a play on the UK economy nor even global growth. It is today more and more a reflection of the outlook for a handful of sectors like mining, oil and gas and banks, none of which are exactly flavour of the month.
The US, by contrast, is home to the industries of tomorrow, notably technology and healthcare. Looked at through the prism of Apple and Google, it is perhaps unsurprising that Wall Street has powered ahead.
Here are a few additional points to remember:
About three-fourths of the revenues of the firms in the FTSE 100 come from overseas. For example, mining is a major sector in the index and the miners have not been performed well in recent years due to the decline in commodity markets. Some of the emerging markets have also been in doldrums hurting the earnings of FTSE 100 firms.
Oil&Gas, Personal and Household goods and banks are the three largest sectors in the index. The Personal and Household goods sector has been adversely by emerging markets and British banks are still suffering from the effects of the global financial crisis. Even Standard Chartered, HSBC(HSBC) and Barclays(BCS) which seemed to be strong during the crisis have seen their share prices fall recently.
Though the FTSE 100 is often used as the benchmark index it is similar to the Dow.Both indices do not represent their respective markets. The FTSE 250 is a better representation of the British economy.
Related ETFs:
Disclosure: No Positions
