Last month Mark Cuban wrote a provocative post on the stock market titled “The Stock Market is still for Suckers and why you should put your money in the bank“. From the post:
If you havena’t noticed, individuals are avoiding the stock market in droves.A There has been an enormous exodus from equity based mutual funds. Why ? Because people buy stocks for only one reason, they want them to go up in price. If you don’t believe the market is going to go up. If you don’t believe you can find a greater fool to buy your stock, or the stock your funds own, why would you buy either ? You wouldn’t and people aren’t.
The amazing thing is that doing nothing in the market is the smartest approach to the market. It is pretty much impossible for some man or woman or child who devotes a couple of hours per week to the market to outperform the professionals who spend 24—7 doing this for a living and when they are asleep, they have a workforce full of people doing more of the same.A In this day and age, none of us are smarter than the market.
I didn’t always think this way.I didn’t ever think there was a truly efficient market until just recently. What changed ? The availability of capital changed. While we can argue about whether or not the market is efficient because everyone has access to the same information, I would always argue that they didn’t efficiently use that information and even if they did, capital was not always allocated correctly to every market segment.
I do not agree with his views. ‘However his piece got me into thinking about why many investors are avoiding the markets. In addition some of my close friends have stayed clear of the equity markets for years and plan to stay that way. However one need not completely ignore the markets. One can make above-average or sometimes excellent returns by investing in stocks provided they pick high quality stocks and diversify their portfolio.
Many years ago ordinary folks invested in equities to receive consistent and high dividends. Capital appreciation was considered secondary and people held equities for years. In the past few decades that has changed.
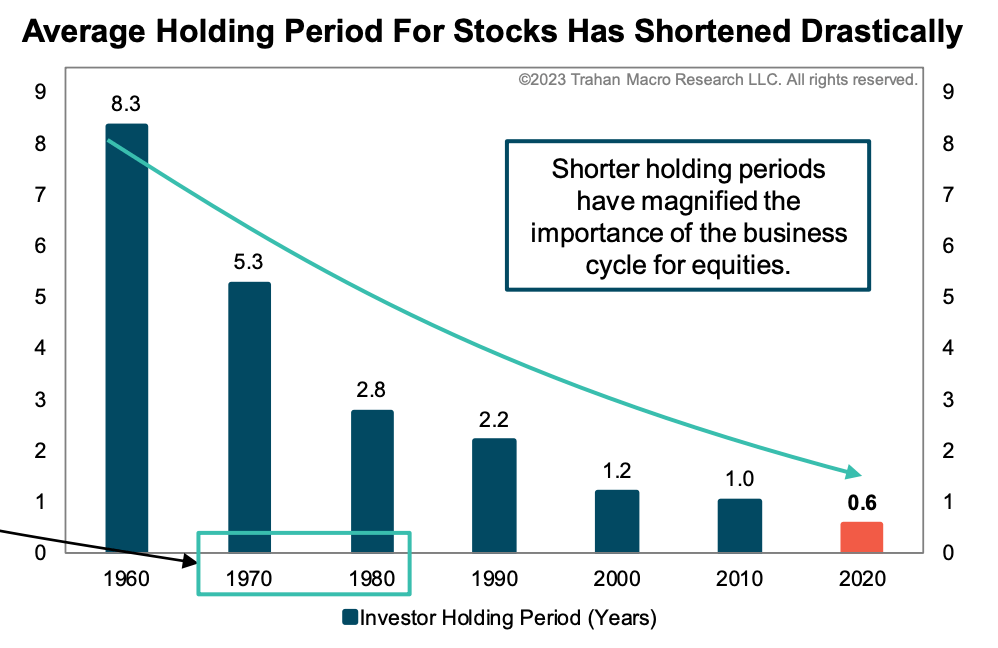
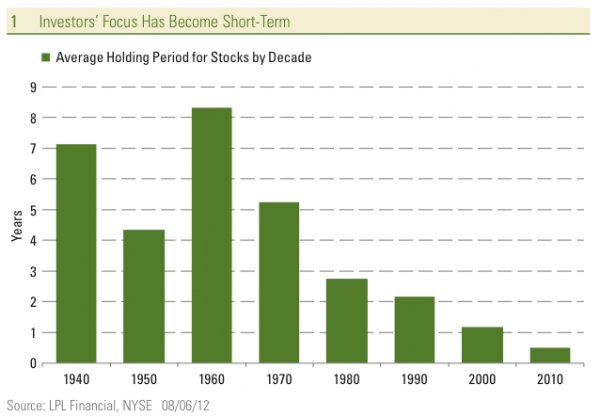
The following charts show the average holding periods for various exchanges over the years:
Click to enlarge


Source: Patience and Finance, Andrew G Haldane, The Bank of England
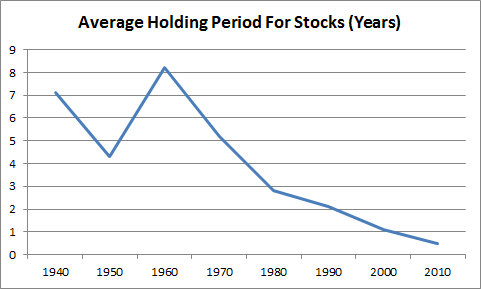
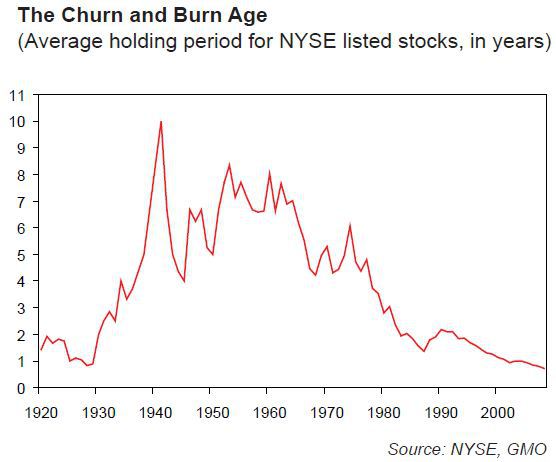
Based on the NYSE index data, the mean duration of holding period by US investors was around 7 years in 1940. This stayed the same for the next 35 years. The average holding period had fallen to under 2 years by the time of the 1987 crash. By the turn of the century it had fallen to below one year. It was around 7 months by 2007.
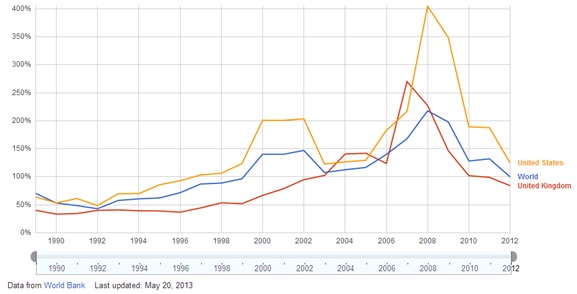
Similar pattern exists in the UK also as shown in the chart above. There the average duration has fallen from around 5 years in the mid-1960s to less than 7.5 months in 2007.
Over the past 15 years even in international equity markets, holding periods have fallen. The Chinese market was red hot until few months ago. However the duration for the Shanghai stock market index is close to just 6 months.This shows that Chinese investors do not have a long term horizon.
Andrew went on to add the following:
A decade ago,the execution interval for HFTs was seconds. Advances in technology mean today’s HFTs operate in milli- or micro-seconds. Tomorrow’s may operate in nano-seconds.
HFTs operate in size as well at speed. HFT firms are believed to account for more than 70% of all trading volume in US equities, 40% of volumes in US futures and40% of volumes in US options. In Europe, HFTs account for around 30-40% of volumes in equities and futures. These fractions have risen from single figures as recently as a few years ago. And they look set to continue to rise.
Asian is not immune from these trends. HFT is believed to account for between 5 and 10% of Asian equity volumes. In China, HFT is still in its infancy. But market contacts suggest as much as 80-90% of trading on the Shanghai stock exchange may be done by day-traders, many small retail investors. Impatience is socially, as well as technologically, contagious.
This evolution of trading appears already to have had an effect on financial market dynamics. On 6 May 2010, the price of more than 200 securities fell by over 50% between 2.00pm and 2.45pm.32 At 2.47pm, Accenture shares traded for around 7 seconds at a price of 1 cent, a loss of market value close to 100%. No significant economic or political news was released during this period.
Hence investors worldwide do not hold their equity positions for long periods. These investors have fallen into the trap that the stock market is a casino where one can trade their hard-earned money and become rich quickly.
Update (Jan 19,2026):
Average Stock Holding Period from 1960:
Click to enlarge
Source: Dopamine Markets: 2025 Annual Letter, Dopamine Markets
Update:

Source: Stock Holding Periods Growing Shorter
Also checkout (Updated Sept 23, 2023):
- Stock Market Participation Rate Across Countries
- Average Holding Period for U.S. Stocks is Just 5-1/2 Months in 2020
- Stock Trading Volume in NYSE and NASDAQ From 2001 To 2010
- Average Stock Holding Periods on Select Global Exchanges
- Stock Market Becomes Short Attention Span Theater Of Trading, Forbes, Jan 21, 2011
- No, The Average Stock Holding Period Is Not 11 Seconds, Business Insider, Oct 28, 2010
- Annual Turnover of U.S. Stocks Remains High, TFS, April 2015
- PORTFOLIO TURNOVER AND COMMON STOCK HOLDING PERIODS (Dow Publishing Co)
- Are Stock Markets Really Becoming More Short Term? (Harvard Law School)
- Gone In 22 Seconds: How Frequent is High Frequency Trading? (The American Prospect)
- The Risk of Holding Periods across International Stock Exchanges (Academic Research Paper)
- Here Comes the Slow-Stock Movement, Jason Zweig, WSJ, Mar 22, 2014
- Why Hair-Trigger Traders Lose the Race by Jason Zweig, The Wall Street Journal, April 10, 2015
- Via Stock Market Investors Have Become Absurdly Impatient, Business Insider, Aug 7, 2012
- From We need investment to return to its ‘patient evolutionary path, BlueandGreenTomorrow, May 27, 2013:
Stocks held for less than four months in UK and USA
The World Bank defines the stock turnover ratio as, “The total value of shares traded during the period divided by the average market capitalization for the period. Average market capitalisation is calculated as the average of the end-of-period values for the current period and the previous period.”
14. Holding stocks for 20 years can turn bad returns to good, 6/8/2011, USA Today
15. China:
Stock holding periods in China are also very low. In June, 2015 turnover of Chinese shares reached a record high as shown in the chart below. As turnover reached a frantic pace, the Chinese equity market crashed swiftly.
Click to enlarge
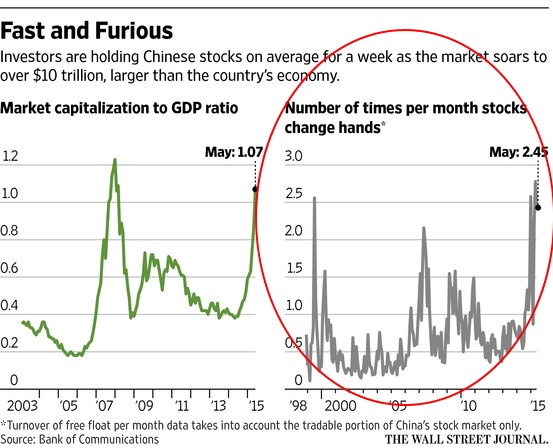
Turnover levels are at a record high, meaning investors are prepared to head quickly for the exits. Investors are holding Chinese stocks just one week on average, according to analysis by Bank of Communications on the tradable portion of the domestic market. Up until now, the firm says the record had been during the height of the Taiwanese bubble in 1989, when investors were holding stocks for roughly two weeks.
Source: Investors Brace for Exit as China’s Stock Bubble Gets Bigger, June 16, 2015, WSJ
16. From article by Cullen Roche:
One would think that more information would make the markets behave more “efficiently”. And while we know that professional investors don’t beat the market consistently we also know that the average holding time on stocks has cratered over the last 70 years which means that investors, in the aggregate, are paying more in taxes and fees than they previously did. In fact, the average holding period is now consistent with a short-term capital gains rate which means the business of active investing has become a lucrative business for Uncle Sam! This means, by definition, that the post-fee and post-tax return on the aggregate of publicly held stocks has to be lower than it was in 1940.
Click to enlarge
Source: Is More Information Making Us Worse Investors?, Cullen Roche, Pragmatic Capitalism
17. Average Stock Holding Period 1900-2011:
Source: Motley Fool
18.Average Stock Holding Period 1948-2012:
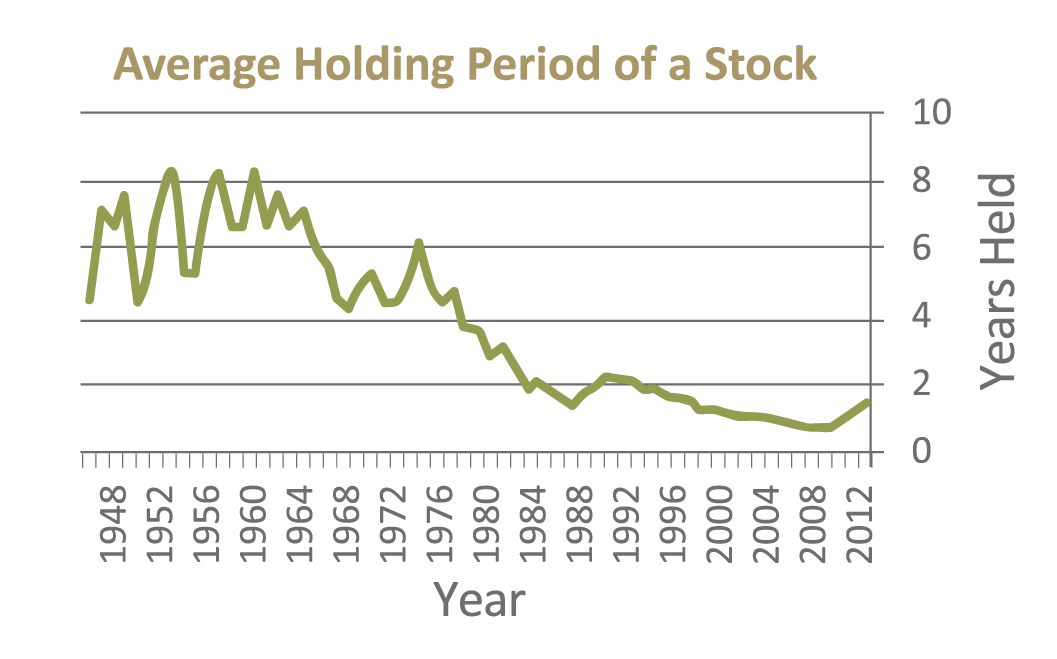
Source: Punch Invest
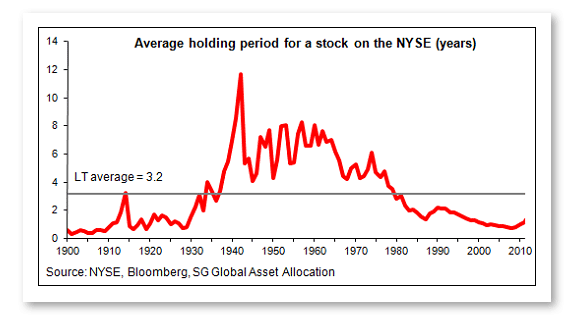
19. NYSE Stock Turnover:
Source: Moneyness
20. Average holding period for NYSE stocks:
Source: Dividends account for 80-100% of world wide stock returns!, Investing for a living
21. Average Holding Period for NYSE Stocks 1950-2015:
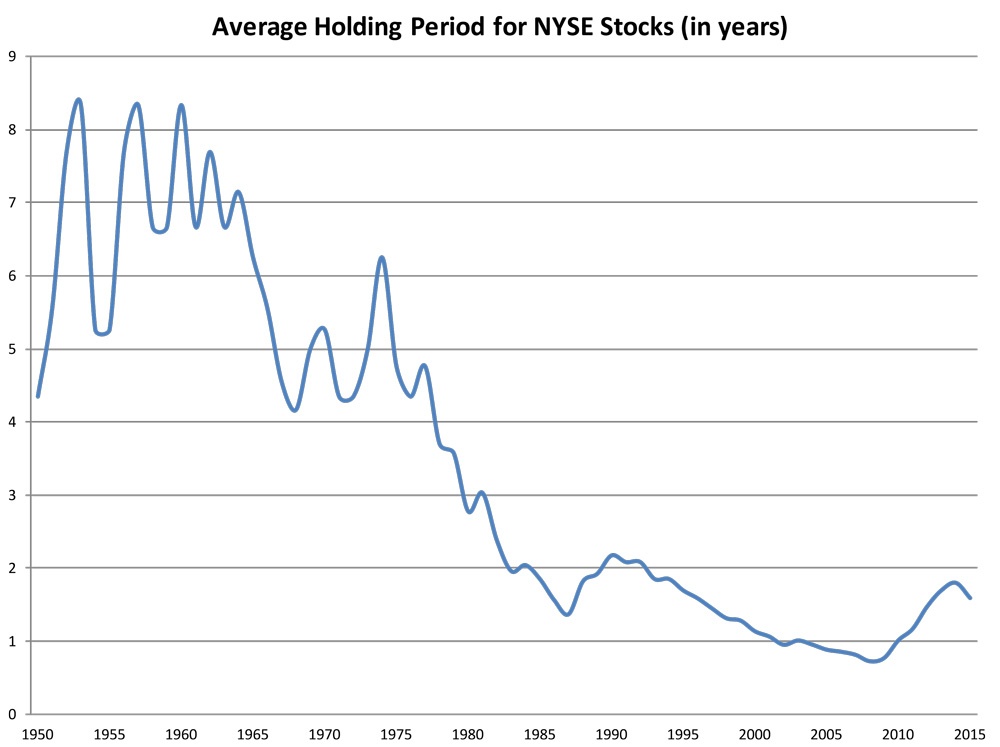
Source: TFG
22. Average Holding Period for Stocks 1940-2015:
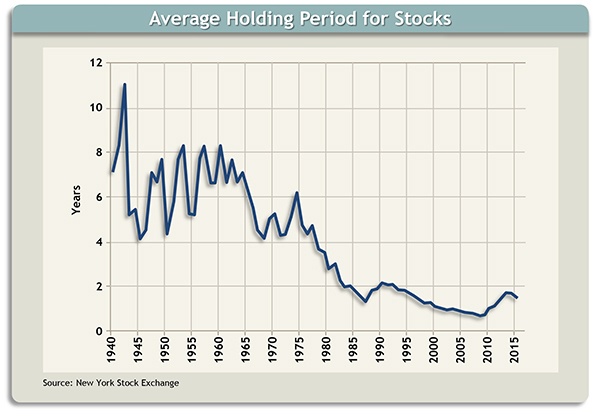
Source: Patience is a Virtue, Oxford Financial Group
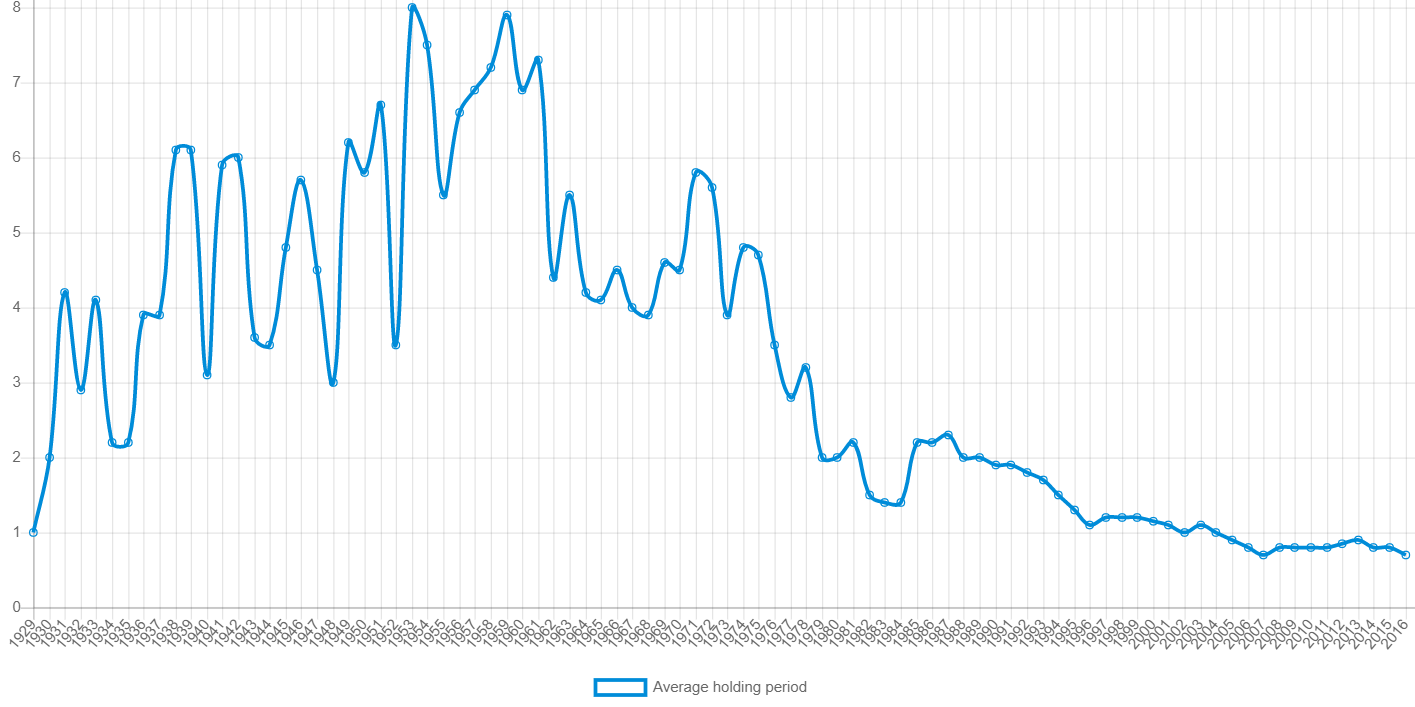
23. Average Stock Holding Period on NYSE 1929-2016
Click to enlarge
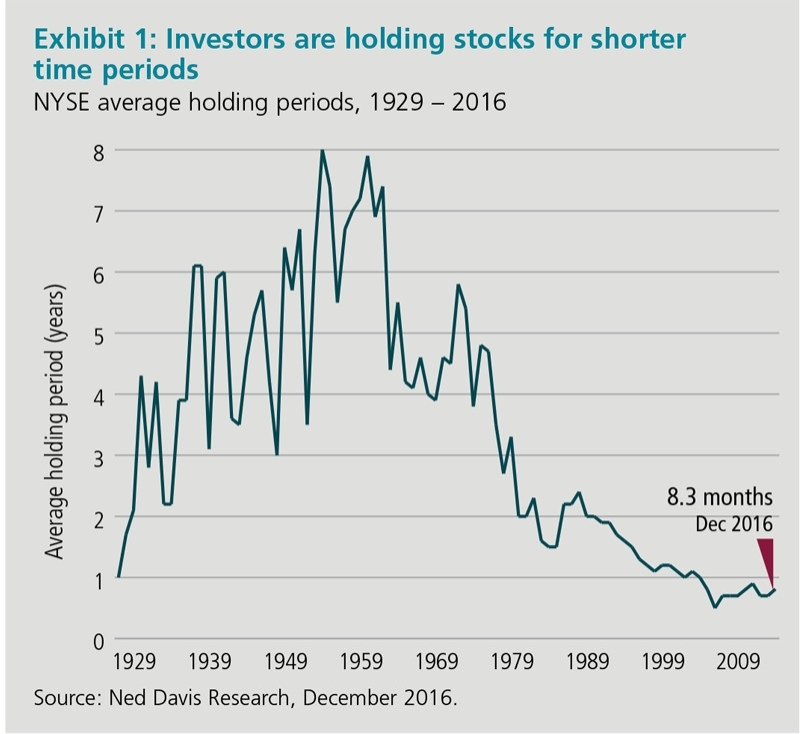
Source: LENGTHENING THE INVESTMENT TIME HORIZON, MFS, July 2017
From the above article:
Stocks are being held for shorter periods than at any time since the 1920s, as the New York Stock Exchange (NYSE) average holding period data shown in Exhibit 1 reveals. On average, a stock is being held for 1.92 years, less than eight quarters. This reflects investment transactions driven by both individuals and institutional investors. Until the 1970s, the investment landscape was largely dominated by wealthy individuals and families; this has since changed markedly, with professional investors now accounting for the largest share of investment activity, though it should be noted that these professionals manage significant mutual fund asset pools that are driven by retail investors.
24. Average Stock Holding Period in Asian Emerging Markets (TFS)
25. Average Holding Period For US Public Companies
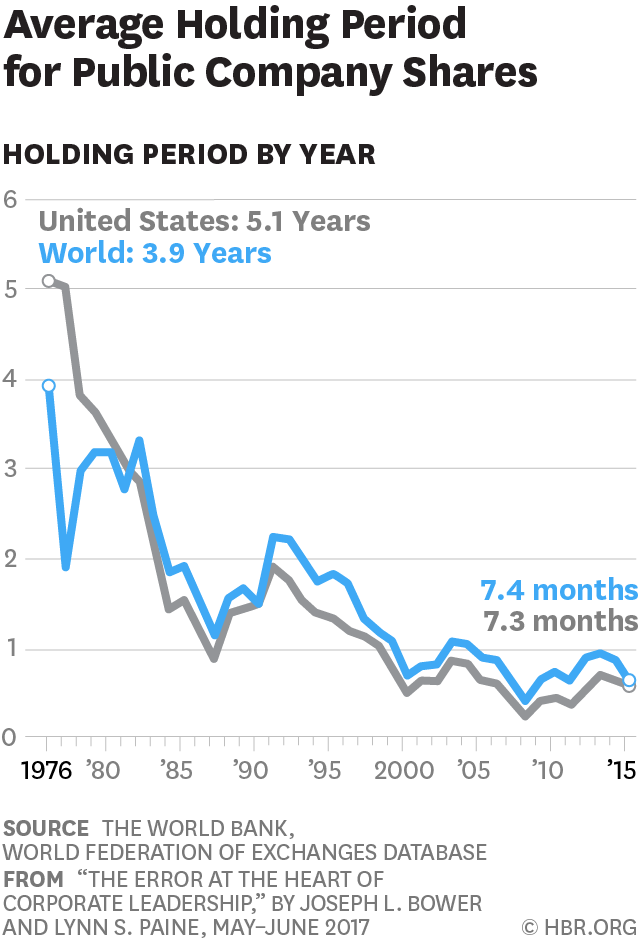
Source: The Error at the Heart of Corporate Leadership, HBR
26.Average Holding Period for US Stocks by Decade:
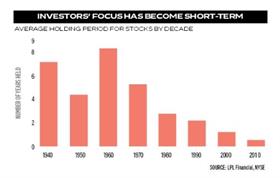 Source: Fin24
27.Average Holding Period for US Stocks from 1920 thru 2005:
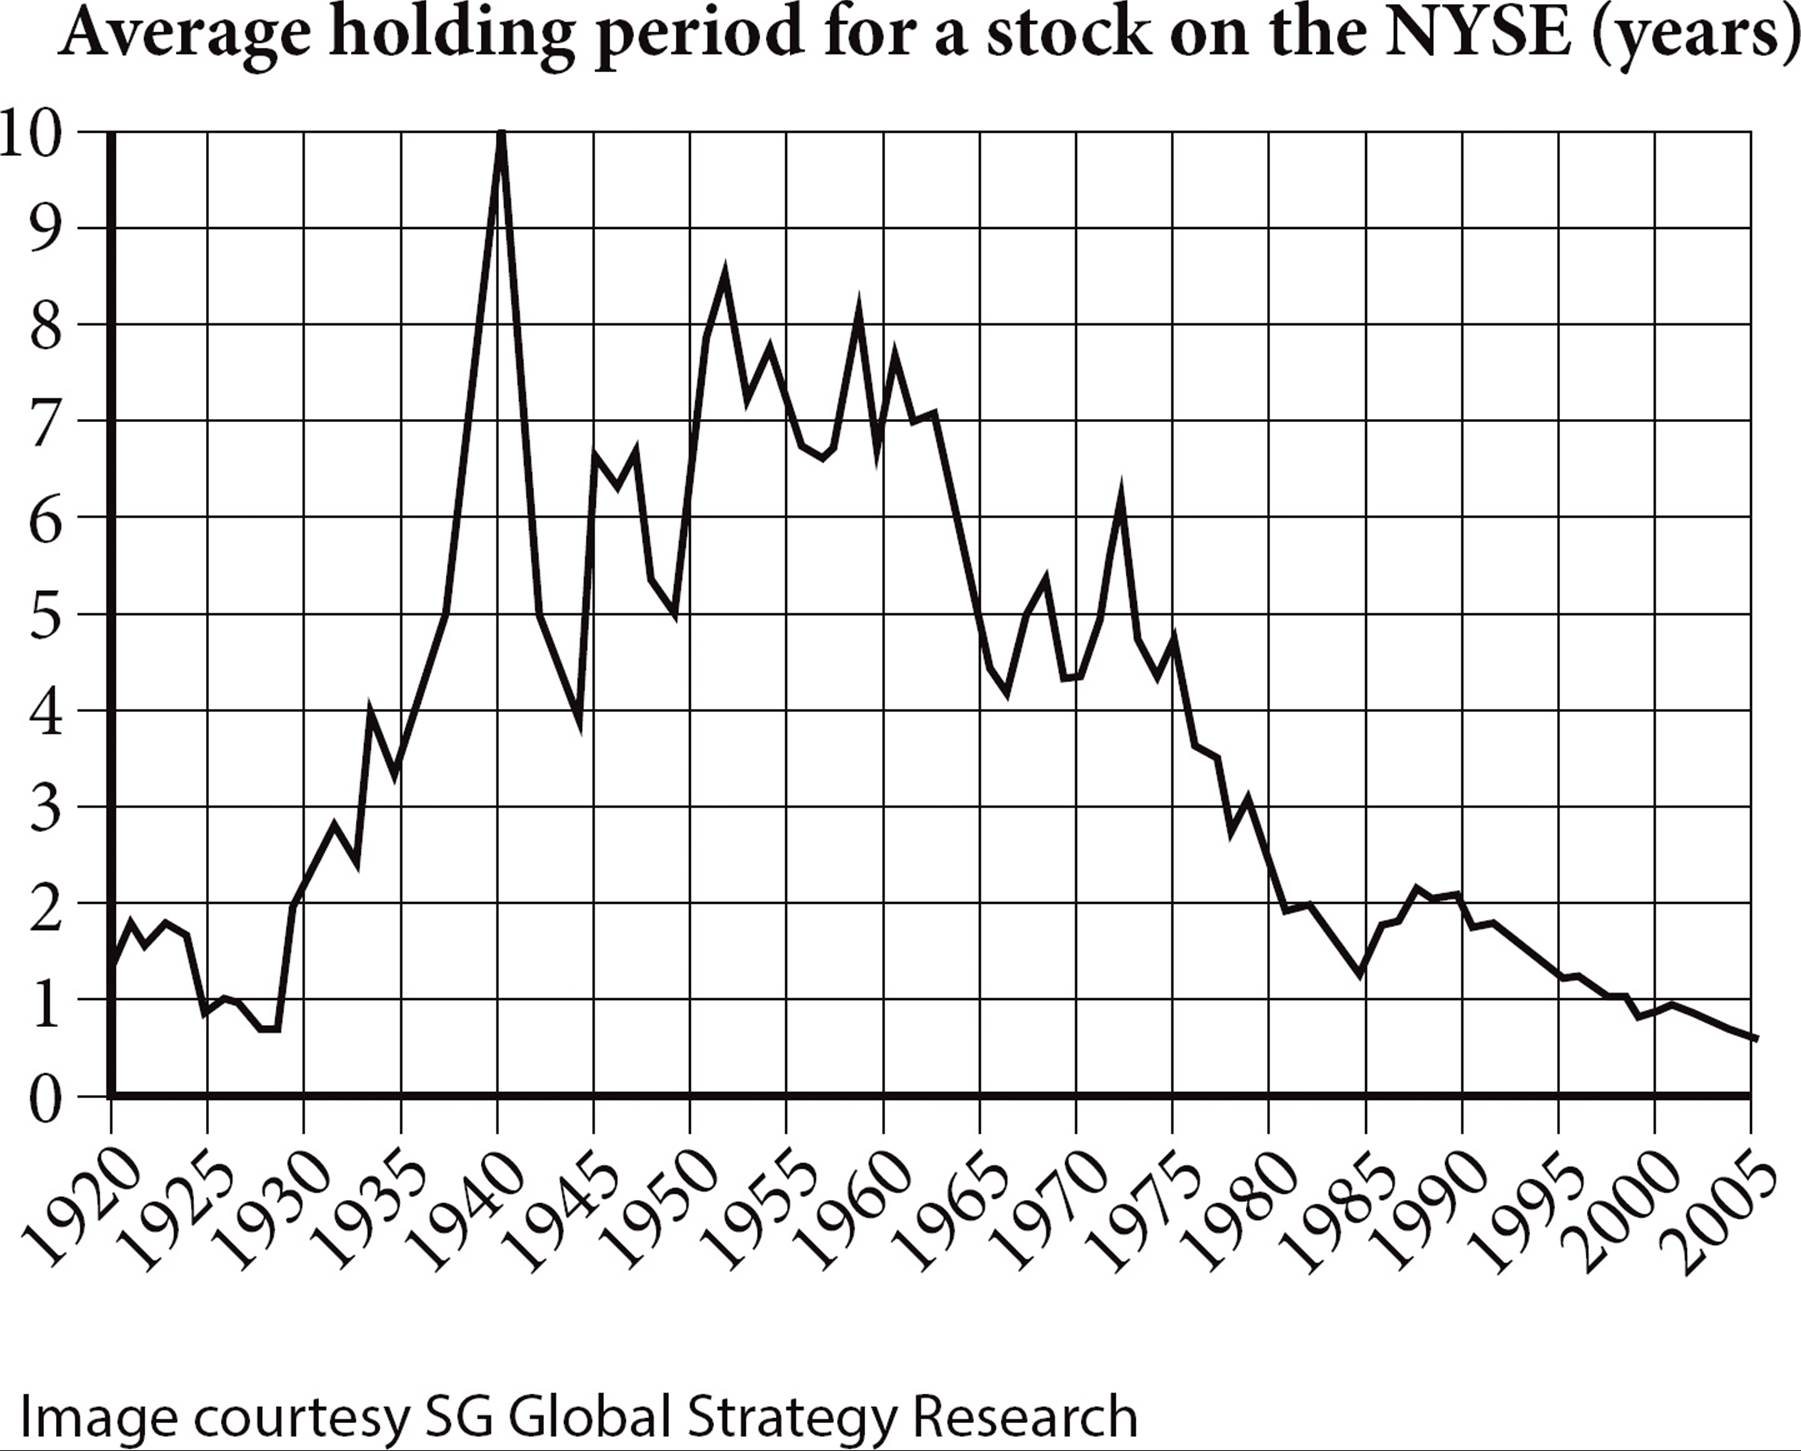
Source: Schoolbag
28.Duration of Bull and Bear Markets in Indian Stock Market, TFS
29.Average Stock Holding Periods for NYSE 1929 to 2018 : Chart, TFS
30.When the Market Moves the Market, Jefferies
31.Buy, sell, repeat! No room for ‘hold’ in whipsawing markets, Reuters
32.Chart of the week: so much for “stocks for the long term”, MoneyWeek
33.Stock returns and holding periods, Research Gate
34.Making Sense of the Changing Structure of U.S. Equity Markets, ARS Investment
35.Average Holding Period for NYSE Stocks thru 2010:
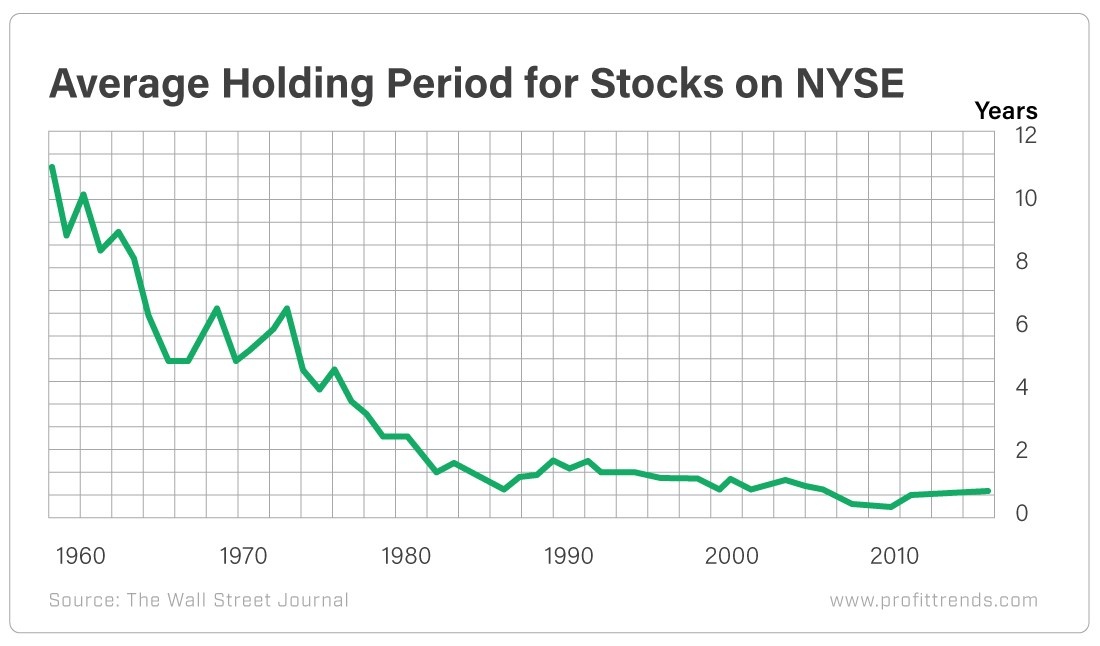
Source: Flash Trading Has Transformed the Investment World, Profit Trends
36.Average Holding Period for NYSE Stocks from 1929 to 2016
Source: https://developmentfinance.un.org/
37.The Decline of Long-Term Investing:
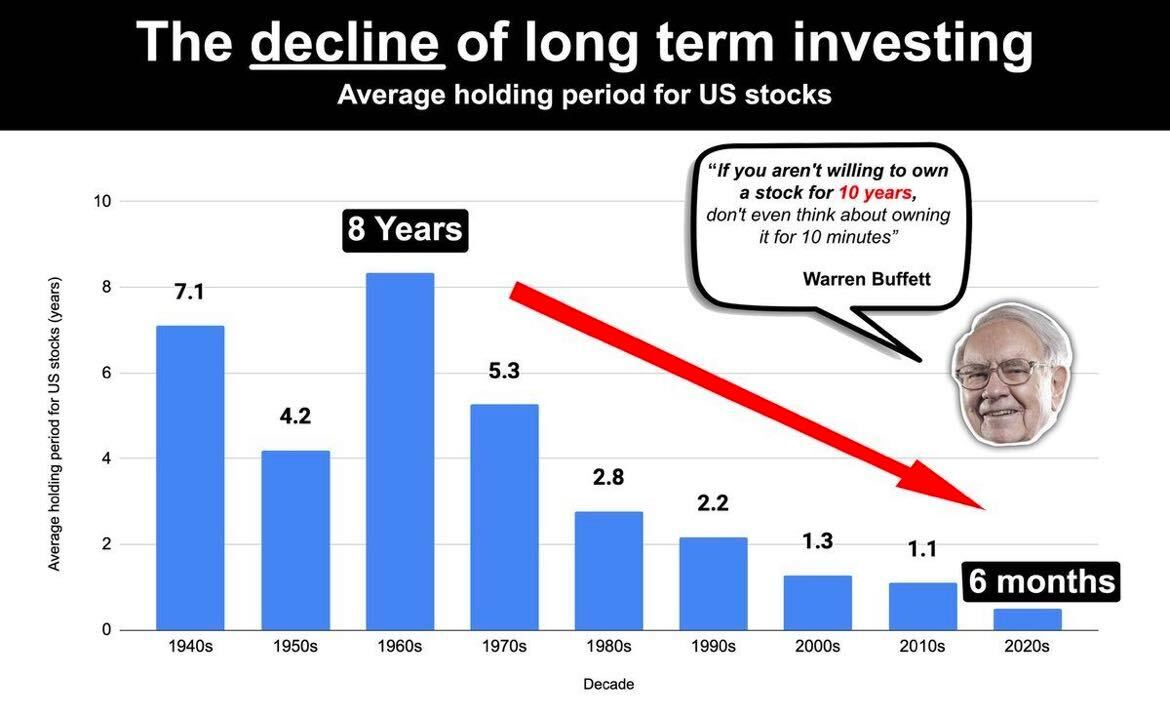
Source: Twitter
38.Average US Equity Holding Period from 1975 to 2022:
Click to enlarge
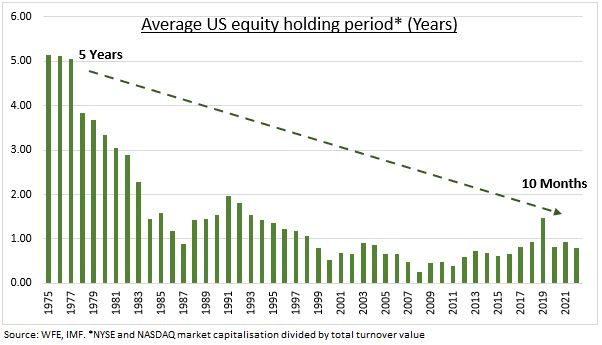
Source: The costs of rising short-termism by Ben Laidler, eToro

That’s why Bubbles will occure more often.