Stimulus Packages Comparison: US Stimulus Is The Largest

Since the credit crisis began, governments around the world have passes many stimulus packages to restart stalled economic growth. For example, today the government of Malaysia announced a second a stimulus package of US$16.3B just after announcing the first stimulus four months ago. In the US, many stimulus packages have been announced during the past and the present administrations. On Feb 13, the US Congress approved a new package of $787B which is 5.6% of GDP. The initial impact of this package will be seen in the years 2009-11. Other countries such the UK, Germany, Canada, etc. have also announced stimulus packages. I wanted to find out how these packages compare across the countries.

My research led me to a paper titled “The Size of the Fiscal Expansion: An Analysis for the Largest Countries” released by IMF last month. The following are some interesting takeaways from this paper.

Of all the large countries that have passed stimulus packages, the US stimulus is the largest in terms of GDP during 2008-10.

Comparison of Stimulus Packages in Large Countries

Stimulus Packages by Country

Source: IMF

The US package amounts to a cumulative 4.8% of GDP during 2008-10. According to Wikipedia, the 2008 US GDP is estimated to be $14.3 Trillion. India and Italy have the lowest packages at less than 1% of their GDP.

Next to US, China has the largest stimulus. Though UK is one of the worst affected countries, the package in the same period is less than Germany’s figures.

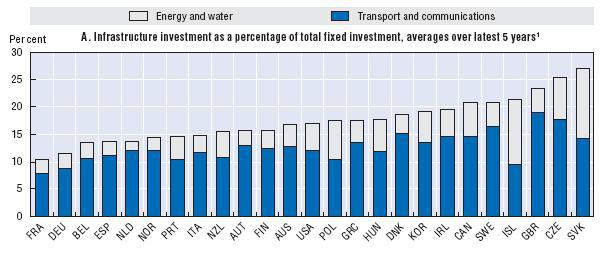
Infrastructure spending by the US is a small portion of the overall packages. As per U.S. CBO and IMF staff estimates, just $32B will be spent on infrastructure projects in 2009 and $47B each in 2010 and 2011.Countries with high public debt have passed smaller fiscal stimulus packages (India, Italy as referenced above). Of the nine countries listed above, only Canada, U.S. and Japan are providing tax benefits to both companies and individuals. The rest of them provide tax benefit only to individuals. One common theme across these countries is that all are planning to invest more in infrastructure project.

You can download the complete paper here.

Pension Funds: Which OECD Countries Are More Exposed To Equities?

One of the fiscal implications of the current financial crisis is the effect on funded pension plans in many OECD countries. Some of the countries’ pension fund portfolios have high exposure to equities and mutual funds. Many of the mutual funds in these countries are also heavily invested in equities.

The following diagram shows the Pension Plan Assets held by Country as of 2007 end (click to enlarge):

OECD Pension Plans

Source: IMF

Research Paper: The State of Public Finances: Outlook and Medium-Term Policies After the 2008 Crisis published March 6,2009

The stripped circles in the above figure shows that 16 countries have pension fund investments in equities and mutual funds greater than 10% of GDP. The countries with high exposure to stocks are Australia, the U.S., Canada, Iceland, The Netherlands, Switzerland, Denmark, and the U.K. Of the emerging market countries South Africa, Chile, and Brazil are more exposed. Countries such as Mexico, Argentina and Norway have limited exposure to the equity markets.

In the US, the asset base of pension plans for the various government workers is huge. At the end of October 2008, the $4 Trillion assets held by these plans had fallen by roughly $1 Trillion. As these plans are defined-benefit plans, the governments will make efforts to fill the gap in the future years either by raising the contributions from current employees or by raising taxes. However this does not affect the social security plan since those assets are not invested in the markets.

If employers go under taking the defined-pension plans with them, then the Federal agency Pension Benefit Guaranty Corporation (PBGC) guarantees payment to plan participants. However this creates a huge liability for the federal government.

According to a Mercer study in the US, the pension plans of the S&P 1500 companies have lost half a Trillion $ in 2008, of which 80% was lost in the last quarter.

The Top 20 Global Banks in 2009 by Brand Value

The London-based world’s leading band valuation consultant, Brand Finance, published the Top 500 Global Banking Brands for 2009 last month. They have published this annual report since 2006 in partnership with The Banker magazine. This list is released annually and is based on data from the world’s largest stock exchanges. Each brand is assigned a ” brand rating: a benchmarking study of the strength, risk and future potential of a brand relative to its competitor set as well as a brand value: a summary measure of the financial strength of the brand”.

HSBC LogoBrand Names – Why are they important?

According to Brand Finance:

“Brands are the most valuable intangible assets in business today. They drive demand, motivate staff,secure business partners and reassure financial markets. Leading edge organisations recognise the need to understand brand equity and brand value when making strategic decisions.”

The following table lists the Top 20 Global Banking Brands for 2009:

[TABLE=142]

Note: AAA = Extremely Strong, AA = Very Strong, A = Strong

Key points from this year’s report:

1.Chinese bank brands are becoming powerful as two of these brands are in the list above.

2. The brand value of developed market banks have fallen more than other banks. US and UK banks have lost 40% and 15% of their brand value respectively.

3. The total number of US banks in the top 500 list has dropped to 95 banks this year.Seven US banks are in the top 20 list which is very interesting since the credit crisis started here many more banks have been shutdown by regulators than any other country.

4. HSBC (HBC) received the highest ranking with a brand value estimate of $25.3 billion and the highest brand rating of AAA+. As the “World’s Local Bank”, HSBC provides customized high quality services in its retail division tailored to each region where it operates. After holding up relatively well compared to other British banks, HBC last week announced a cut in dividend payout by 29% for the year and a rights issue.

5.The only emerging markets bank in the top 20 is Banco Bradesco (BBD) from Brazil other than the two Chinese banks.

6.Spanish bank Santander(STD) will become the 3rd largest private sector bank in Brazil after merging its operations with Banco Real.

7. Financial institutions such as American Express(AXP), Citibank(C), Bank of America (BAC) still have high brand premiums though their market capitalizations have reduced significantly.

You can download the full report here.

Oil ADRs: Which Stock is Leading So Far This Year?

The S&P 500 Index is down 24.43% as of March 5, this year. The energy sector components within the index have fallen 21.11% in the same period. As the recession deepens, the consumption of gasoline has decreased. After soaring to over $140 last year, Crude Oil is now in the $40 range. Today the April delivery of crude oil trades at $44.25 per barrel.

Some experts have predicted that crude will fall to $30 level some time this year. However this has to be taken with a grain of salt since last year similar experts said that the price will cross over $200 per barrel.

In the US markets, 21 ADRs related to the oil& gas production, distribution and equipment service are traded. The following is the performance of these ADRs as of March 5:

[TABLE=141]

Chart (click to enlarge):

Oil ADRs

The only oil ADR that is in the positive territory this year is Petrobras (PBR) of Brazil. The giant oil companies – TotalFina (TOT), Royal Dutch Shell (RDS.A , RDS.B), British Petroleum (BP) – are all down over 20%. The worst performing stock is YPF of Argentina with a loss of 61%.

The recently listed EcoPetrol (EC) of Colombia is holding up well. Eni Spa(E) of Italy is an attractive play at current levels since it pays a dividend of 10.66% and operates both in the production and distribution of natural gas and oil.

Can Infrastructure Spending Revive US Economic Growth?

Infrastructure is one of the key sectors that will see large investment as part of the massive $787 billion package signed President Obama last month. The law titled “American Recovery and Reinvestment Act” will promote investment in infrastructure such as roads, bridges, electricity grid, etc. Billions of dollars will pour into these projects over the next months.

But is this infrastructure spending necessary now? Will it help revive the long-term economic growth?.

According to the Organization for Economic Cooperation and Development (OECD) spending on infrastructure projects will be beneficial for long-term prosperity. Yesterday March 3rd, the OECD released the Going For Growth 2009 report. This flagship “annual periodical provides an overview of structural policy developments in OECD countries from a comparative perspective.” In this report, Klaus Schmidt-Hebbel, the Chief Economist says that infrastructure performs a vital role in the functioning of our economy. However in the past, some investments made in this sector have been wasteful.

The report identifies many policies that can “both boost demand in the short term to soften the impact of the recession, and also raise economic growth over the long term. This ‘double dividend’ can be achieved by pursuing policies areas such as:

  • Increased spending on infrastructure
  • Increased spending on active labor market policy
  • Reduction of personal income taxes

Charts – Investment in Infrastructure Sectors (click to enlarge)

A)Infrastructure Investment as a % of Total Investment

OECD Infastrucure - Water

The above diagram shows that the USA has lagged in infrastructure spending on energy and water, transport and communications in the last 5 years when compared to other OECD countries such as Sweden, Denmark, Korea, Great Britain, etc.

B) Electricity, Gas and Water Investment as a % of GDP

OECD Infrastructure - Electricity

In the years 2000-2006, we spent below the average in electricity, gas and water investment as a % of GDP. Less than 1% of the GDP went into these areas. Sweden, Norway, Israel, Korea, Ireland spent more than USA in these sectors during the time period. The US invested a higher portion of the GDP during the 70s and 80s but has slipped in the past few years.

C) Transport and Communications Investment as a % of GDP

OECD Infrastructure - Transport

Source: OECD -Going For Growth 2009

Investments in transport and communications were less than the average of all OECD countries during 2000-06. Only France spent less than us in the same period. Many countries such as Austria, Australia, Sweden, Korea, Spain spent a larger portion of their GDP on these two sectors.

In summary, from the above three charts it is clearly evident that infrastructure spending needs to be increased in the US. The OECD report mentions that investment investments may have positive spillovers throughout the other parts of the economy. But to reap the full benefits of such investments, it is essential to carefully select projects that will deliver the most benefits. Furthermore strong regulatory measures must be in place to ensure competition among market players in executing the projects. While I agree with Klaus Schmidt-Hebbel on the “double dividend” theory it is not 100% sure that infrastructure spending will revive growth in the US. This is due to the fact that the US economy was mostly supported by the consumer spending. It is unlikely that the consumer will start spending again with just because of all the new roads, bridges, schools, green buildings, etc.However in the long-term having high-quality infrastructure will promote sustainable growth and improve the standard of living.