Funding Retirement: Employers Share Vs. Employees Share

Interesting chart from OECD Observer on retirement contributions by employers  Vs. employees in select OECD countries. Unfortunately USA was excluded in this chart.
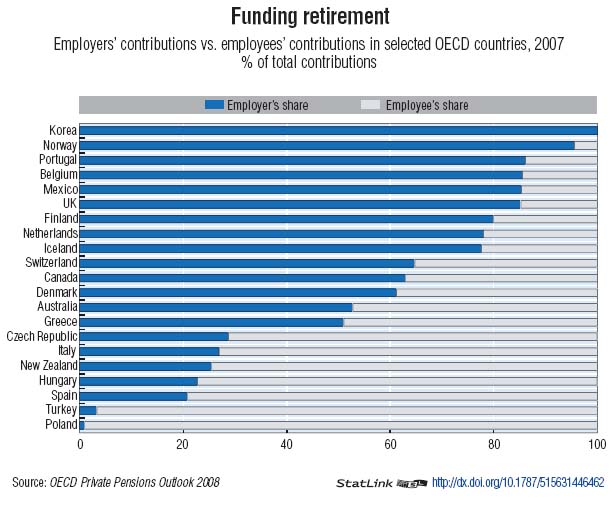
Pension Funding in OECD Countries

Source: OECD Observer

Excerpts from the report:

“If you are a Polish worker, then you are probably paying 99% of total contributions, which is the highest in the OECD area. Turkey’s workers contribute a little less, with 97% of the total. In Portugal, on the other hand, employee contributions account for 14% of the total, while workers in Norway pay in just 4% to personal pension plans. In recent years, employers’ contributions to defined benefit plans-those pension plans that are linked to salaries-have grown, largely in an effort to reduce gaps in funding to cover growing benefit payments in light of population ageing.

Pension fund contributions by employees and employers combined grew substantially in 2007 in those countries with large defined benefit systems, such as Canada, the Netherlands, Switzerland and the UK. Australia, Iceland and Finland recorded the highest ratios of pension fund contributions-to-GDP. All three countries had ratios over 10%. “

Daily Wisdom: Resource-Rich Russia Edition


China’s stocks have been enjoying a rally since mid-March and one of the reasons could be the leakage of stimulus funds into the stockmarkets. Stimulus money leaking into Chinese stocks

Nobel Prize-winning economist Paul Krugman says the UK economy is the best in Europe at the moment. UK’s economy is ‘best in Europe’

Two European nations are considering taking over public pension plans, converting their assets of approximately $34 billion into cash for general government use and turning the plans into pay-as-you-go systems.2 European countries turn plans into cash

Often after a sharp economic downturn we observe an equally dramatic recovery. But nobody can claim to be seeing that so far in the currently available data.Not a robust recovery

Recovery for resource-rich Russia is tied to the price of oil, natural gas, other commodities.EMERGING MARKETS – Russia: risk vs. reward

Economies of Developed World Projected To Get Worse Before Recovery

Most markets in the developed world have rallied sharply since hitting the lows in March this year.For example, the S&P 500 is has rallied 40%  from March lows as of yesterday. Fed officials and many others have been talking up the economy and there have been talk of “green shoots” appearing in the economy.Some economists are projecting a recovery in the second half of this year.

Despite rallies in the stock markets and talk of recovery, the recent Global Financial Stability Report by IMF states that economies of the developed world will experience a deeper protracted recession due to further deterioration in residential and commercial real estate markets, tight lending conditions and rising defaults in  corporate and consumer loans.

US-Loan-Charge-offs-Chart

Futures are pointing to further declines in the US and UK residential mortgages of  both prime and subprime loans. Loan workout programs and foreclosure moratoriums have failed to reverse the decline in the housing market. The charge-off rates in residential real estate market in the US is projected to peak in late 2010. Commercial mortgages are projected to follow the residential markets and has already begun to worsen in the US and UK.

US-European-bank-Earnings-Writedowns

Source: Global Financial Stability Report, Responding to the Financial Crisis and Measuring Systemic Risks, April 2009, IMF

Writedowns by financial institutions in 2010 is estimated to be equal to the total writedowns in 2009. European and US Bank’s earnings before provisions are projected to drop between a third and half all the way thru mid-2010. Total charges  is expected to peak at 4.2% in the US, 3.4% in the UK 2.8% in the Euro zone. These levels are well above those experienced during the Great Depression in the USA. Banks in Europe and USA would post losses thru 2010 though a modest return to flat returns is possible in 2010.

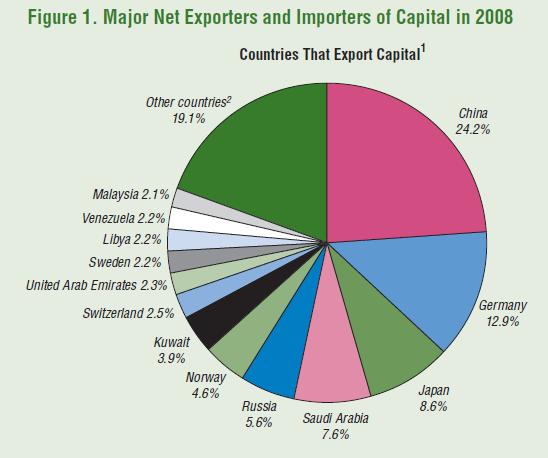
The Top Net Capital Importers and Exporters of Capital in 2008

Last month I wrote an article about the Top Ten Creditors to the USA. Today we shall review two charts that show the top net exporters and importers of capital in 2008.

Countries that Export Capital in 2008

Countries that Export Capital

The largest net exporter of Capital is China with 24.2% of total. This is not surprising since China is the largest buyer of US debt holding $767 Trillion at the end of March,2009. Interesting to see Germany as the second largest exporter next to China and ahead of Japan. These top three countries accoutn for nearly 46% of total capital exports. Most of the remaining countries in the chart (except Other countries at 19.1%) are net oil exporters. For example, Malaysia is in the list since it exports more crude oil than domestic consumption.

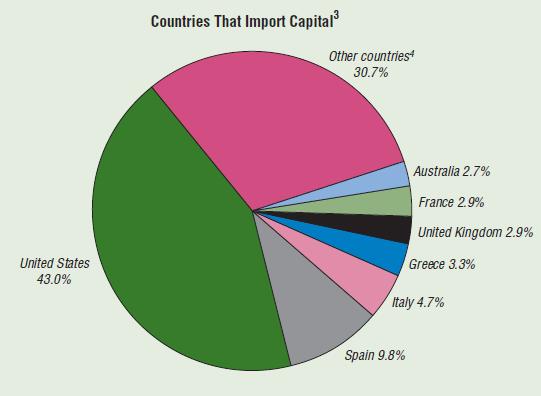
Countries that Import Capital in 2008

Countries that Import Capital

Data Source and Notes: IMF, World Economic Outlook database as of April 16, 2009.
1 – As measured by countries’ current account surplus (assuming errors and omissions are part of the
capital and financial accounts).
2 – Other countries include all countries with shares of total surplus less than 2.1 percent.
3 – As measured by countries’ current account deficit (assuming errors and omissions are part of the
capital and financial accounts).
4 – Other countries include all countries with shares of total deficit less than 2.7 percent.

USA was the largest net importer of capital receiving 43% of all capital exported since it is the most favored destination for primarily China and Japan. Despite the collapse in the real estate sector, Spain came second followed by Italy. UK attracted just 2.9% of total capital in spite of London being one of the important financial center in the world.

Source: Global Financial Stability Report, Responding to the Financial Crisis and Measuring Systemic Risk, April 2009,  IMF