Some US Community Banks Are Getting Strong

A report by the The Independent Community Bankers of America (ICBA) and Aite Group, LLC states that community banks are getting strong in this difficult time and are positing themselves for a recovery in the economy. The report titled Impact of the Financial Crisis on U.S. Community Banks: Difficult Times, New Opportunities was based on a survey of 743 community banks.

Community-Banks-Survey

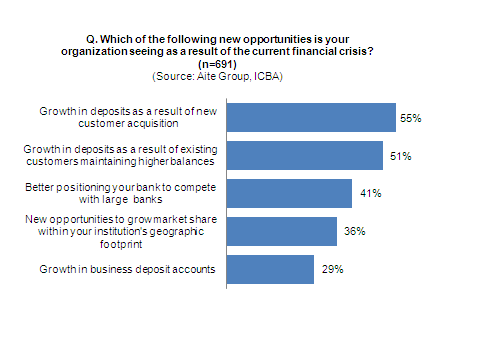
Key takeaways from the community banks surveyed:

Banks that saw Increase in Deposits = 55%
Customers who withdrew Deposits = 17%
Banks who saw increase in new retail customers = 57%
Banks who saw increase in new business customers = 47%
Banks that saw loan originations volume increase = 40%
Banks that saw increase in loan delinquencies and charge-offs = 73%

This survey clearly shows that community banks are getting hit hard with charge-offs. The loan types include mortgages (residential and commercial), credit card debt, personal loans, car loans, etc. Growth in number of customers and deposits shows the confidence of consumers in these community banks when compared to large banks. This should help the survivors when the economic recovers.

The rise in loan delinquencies and charge-offs is leading to some of the small and medium banks to fail. So far this year 40 banks have been shutdown by the FDIC.Most of them are small banks. Yesterday three more banks failed. They are:

First National Bank of Anthony, Anthony, KS   (Total Assets =$156.9 M, Total Deposits =  $142.5 M)
Cooperative Bank, Wilmington, NC  (Total Assets =$970  M, Total Deposits =  $774 M)
Southern Community Bank, Fayetteville, GA  (Total Assets =$377 M, Total Deposits =  $307 M)

Of the hundreds of listed community banks some will emerge strong from the current crisis.Unfortunately until the economy recovers there will many more bank failures like the three that failed yesterday.The trick to investing in banks is to identify the banks with a respected franchise, strong balance sheet and good management team.

The Top 5 Coal and Iron Ore Exporting and Importing Countries

Countries such as Canada, Australia, Brazil ,etc are blessed with plenty of natural resources and they are big exporters of commodities such as Natural Gas, Iron Ore, Coal, Natural gas, etc. In this post let us take a look at the top five coal and iron ore exporters and importers in the world.

Top five coal and iron ore exporters and importers

Via Reserve Bank of Australia Bulletin, January 2009, Australia and the Global market for Bulk Commodities

From the above table, we can infer that China is the largest producer and consumer of coal (thermal and coking) in the world.This is due to the heavy industrialization taking place in China in recent years.Nearly 75% of thermal coal in the world is produced and consumed by China, USA and India since the demand for coal is high in these countries. In the USA, coal is still the major resource for generating electricity. Despite the movement to go green, coal will continue to the main source for electricity production in the USA for many years to come as per a report by the Energy Information Adminstration.

Electricity Generation by Fuel in USA

Coal Fired Plants Growth Chart in USA

Source: EIA’s Annual Energy Outlook, 2009

Coking coal is used in the production of steel.China produces 20% of iron ore and uses the coking coal to produce steel. Since demand exceeds local supply, China imports additional iron ore from other countries such as Brazil and Australia.

Europe and Japan consume large quantities of all coal and iron ores but have to import them.Australia was a major exporter of coking coal  and iron ore. China is the largest consumer of iron ore and Brazil and Australia are the largest exporters accounting for 64% of the total supply.

Related Commodity and Country ETFs:

  • Market Vectors Coal ETF (KOL)
  • Market Vectors Steel ETF (SLX)
  • iShares MSCI Austrlia ETF (EWA)
  • iShares MSCI Canada ETF (EWC)
  • iShares MSCI Brazil ETF (EWZ)

A Review of Tier 1 Capital Ratios of Large US Banks

A bank’s Tier 1 Capital Ratio is an indicator of its strength and ability to absorb losses. Regulators  in the USA and other countries are now using this factor in addition to others to identify banks that are likely to collapse.

The Tier 1 capital ratio is the ratio of a bank’s core equity capital to its total risk-weighted assets (Source: Wikipedia). This ratio is considered to be a more reliable measure of financial strength than other numbers that can be calculated to evaluate a bank. In general, the higher the ratio the better the bank. For example, a bank having a Tier 1 ratio of 20% is better than the one with less than 10%. Higher Tier 1 ratio implies that the bank is being run very conservatively.

The following chart shows the Tier 1 Ratios of thirteen large  banks in USA.These numbers were pulled from their first quarter, 2009 earnings report. The Tier1 ratios include TARP funds if a bank accepted it. Hence in some cases the Tier 1 Ratio is higher than it was originally. Some of these banks listed in the chart below repaid billions in TARP funds this week.

Large US Banks Tier 1 Capital Ratios 

Chart

Tier 1 Capital Ratios of Large US Banks

Table

[TABLE=155]

Source: Bank 1Q,2009 Earning Reports

State Street (STT) is highly conservative since it has a Tier 1 ratio of 19.13%. Wells Fargo(WFC) on the other hand had the lowest ratio at 8.28%. Despite heavy TARP infusions Bank of America (BAC) and Citibank (C) have Tier 1 ratios of just 10.09% and 11.80% respectively. Other than State Street, Bank of New York Mellon (BK) and BB&T (BBT) have high Tier 1 ratios of above 12%. Some might argue that the capital ratios of US banks that accepted government funds may not be a good indicator of financial strength since the numbers are inflated. However it is still worth monitoring on a quarterly basis as wild swings in the Tier 1 ratio can be indicator of other problems.

Daily Wisdom: Dow Jones Stoxx Blue-Chip Indices Edition

PROFIT 100: Canada’s Fastest-Growing Companies
The firms that make up PROFIT’s 21st annual ranking of Canada’s Fastest-Growing Companies are role models of the first order. After all, they have grown their annual revenue by an average of 2,262% over the past five years (2003-08), and no company on the list grew by less than 899%.

Dow Jones Stoxx Blue-Chip Indices – Information and Factsheets can be found here

MIND mapping, a form of visual outlining, may seem superficial, but it is a powerful tool for managing information overload.The power of mind mapping

Jun-18-2009 | J.P.Morgan announces the proceeds due American Depositary Receipt (“ADR”) holders with respect to the unregistered rights offering from Enel (OTC: ENLAY). Enel Societa per Azioni (“Enel”) – ADR unregistered rights offering/final rate announcement

Union: German energy giant E.ON to slash 9000 jobs
Unions warn that restructuring efforts at E.ON will result in thousands of jobs cut worldwide. Around 4,000 jobs are to go in Germany alone. The company reported an 18 percent first-quarter profit increase.

Current State of the Brazilian Economy

Investors have been pouring money into emerging markets this year. Stock market indices in Brazil, Russia, China, India, etc are up over 50% since the March lows. The ishares MSCI Brazil Index ETF (EWZ) is up 57.69% year to-date till the end of last month.

In order to  check the current state of the Brazilian economy,I reviewed a presentation  titled “Brazil: Economic Prospects, May 2009” by Mario Mesquita of Banco Central Do  Brasil. Some of the key points are discussed below.

1.Brazilian bank’s are well capitalized. At the end of 2008, the  stood at 18% which is well above the regulatory requirement of 11% and the Basel minimum of 8%. Hence banks such as Itau Unibanco (ITUB), Banco Bradesco (BBD) are well-positioned for an economic recovery.

Brazil Banks capital adequacy ratio

However the delinquency ratio rose from 4.4% in 2008 to 5.0% in first quarter this year. This is a cause for concern and must be monitored thru the rest of the year.

Brazil bankS delinquency ratio

Credit to new vehicles has started to pick up from March. This shows that consumers are able to buy new vehicles and finance them with credit.

Brazil Vehicle Loans

In addition to vehicles loans, credit for housing has also increased this year. Year-to-date it is up 9.2% as the chart shows below. This number is important to keep an eye on since housing is an important sector for credit growth.

Brazil Housing Loan Growth

Brazil ranked 2nd this year for attractiveness of emerging markets among private equity fund managers for the next 12 months.

Brazil Attractive market

Long-term growth in retail  is in tact and vehicle production was up in March as well.

Brazil Car Production

Brazil retail growth

Source: Brazil: Economic prospects, May 2009
Mario Mesquita, Banco Central Do  Brasil