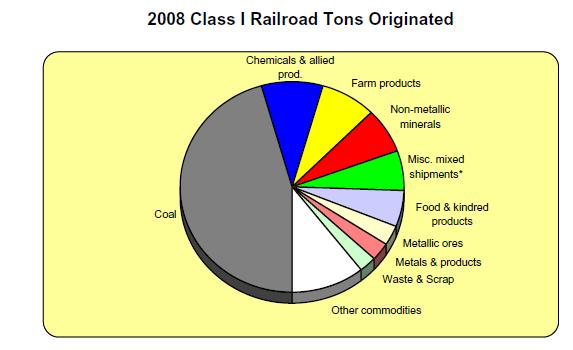
Source: Association of American Railroads
Quick Take:Â Coal accounted for 45.4% of all commodities carried by Class I railroads in 2008 and 23.5% of total revenue.
Related Posts:
Source: Association of American Railroads
Quick Take:Â Coal accounted for 45.4% of all commodities carried by Class I railroads in 2008 and 23.5% of total revenue.
Related Posts:
Consumers have been cutting down borrowing since the credit crunch began. However the Federal government borrowing has been growing at a staggering rate recently as the chart from CFR’s Brad Setser’s blog shows below.
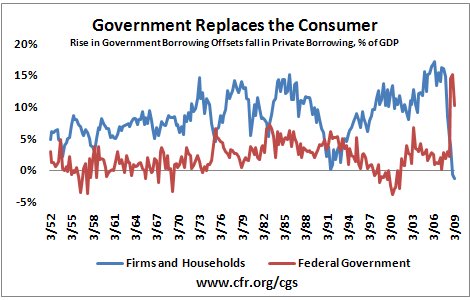
Source: Council on Foreign Relations
Checkout also More on the fall in private borrowing and the rise in the fiscal defict.
Historically the unemployment rate in the USA was lower when compared to European countries due to US economy being dynamic and vibrant.The policy of hire and fire by companies was accepted by the society as a means of keeping the economy strong.However this situation in changing due to the continued rise in unemployment rates in the past couple of years.
The US unemployment rate is getting closer to unemployment rate in Europe as the charts show below (click to enlarge image):

Source: International unemployment rates and employment indexes 2007-2009 (seasonally adjusted), Bureau of Labor Statistics, Division of International Labor Comparisons
The US unemployment rate exceeded Germany’s rate in April and was very close to the rate in France. This is highly significant since these two German follow socialism and have always had high unemployment rates. For example, in France it is normal to have unemployment levels above 8%. In the above chart except France, the US rate is higher than all countries. While governments in Europe dole out liberal unemployment benefits it is not the case in the US where unemployment benefits are capped and stop after some weeks. Another factor is in the US, health insurance is a huge expense for the unemployed. In Europe due to national health insurance unemployed workers do not have to worry about medical care.
The US unemployment rate for the month of May was 9.4% which is higher than the 8.9% shown in the chart above.To put this in perspective, in April France had an unemployment rate of 9.2%.

Unemployment levels in Spain and Ireland have been rising at a steep pace in the last few months.In Spain it exceeds an incredible 18% primarily due to the collapse of the real estate boom.
Hundreds of ETFs are listed on the exchanges. However not all of them are able to attract significant amount of assets. The following are the top 10 global ETFs by Total Net Assets:
EEM and EFA have assets of $30.7B and $30.2 B respectively as of June 19,2009 making them the largest two international ETFs. Nearly half of the top 10 ETFs are related to emerging markets. This shows that investors are betting heavily on emerging markets this year. EEM, the largest emerging market ETF is also one of the largest traded ETF in the NYSE on a daily basis. Not surprisingly the ETF for China has the third most assets since China is one of the most favored destination for investors. The iShares Brazil ETF (EWZ) offers exposure to most large Brazilian companies as it tracks the Bolsa de Valores de So Paulo index.
The World Bank maintains the database of Gross External Debt Positions of countries.The top five countries with the largest external debt are as follows:
[TABLE=156]
The USA is the most debtor country with a total of $13.6 Trillion at the end of 2008.On a year-over-year basis this represents an increase of 1.6%. In order to see the creditors to the US, you can check my earlier post titled Top Ten Creditors to the USA. The country with the second largest debt is UK.Total external debt of UK stood at $9.3 T. Though this may seem large at first glance, it is actually good since the UK reduced their debt by 19.9% from 2007.All the top five debtor countries are developed rich countries.This is fascinating since these countries are able to borrow so much money to keep their economy moving forward.
The countries with the lowest amount of debt are:
[TABLE=157]
All the above countries are small countries in the developing world. Armenia has the lowest debt at $3.4B. However this was an increase of 15.1% from 2007.
Some of the countries have been reducing their external debt.Switzerland the UK reduced the most at nearly 20% from 2007. Other countries that have decreased their debt in 2008 include Australia, Canada,Israel, Egypt, etc.
The list below shows the countries that reduced their debt in 2008:
[TABLE=158]
 The countries that increased their external debt in 2008 compared to 2007 are:
[TABLE=159]
Georgia was the worst with an increase of over 25%.Hungary almost collapsed due to the heavy debt load before it was rescued earlier this year.
The external of a select few countries and the year-over-year change are shown below:
[TABLE=160]
Data Source: The World BankÂ
Latvia had $42B in debt as of 2008.The other Baltic countries of Lithuania and Estonia also have high debt levels. China had nearly $660B debt but that was a reduction of 7.7% from 2007.
Download: List-of-countries-with-their-debt-as-of-2008 (excel file)