The Organisation for Economic and Co-operation and Development (OECD) released the “OECD Health Data 2009” report which compares the health care statistics across OECD countries.
Some of the key points from this study comparing the U.S. health care system with other countries are listed below:
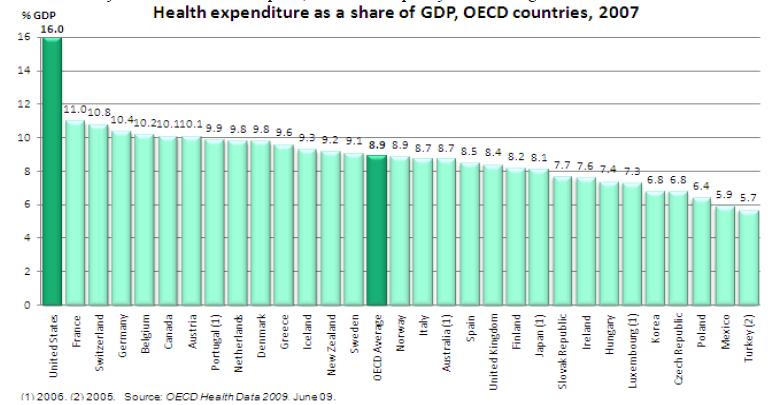
- In 2007, the total spending for health care accounted for 16% of the country’s GDP, the highest share among the OECD and almost double the OECD average
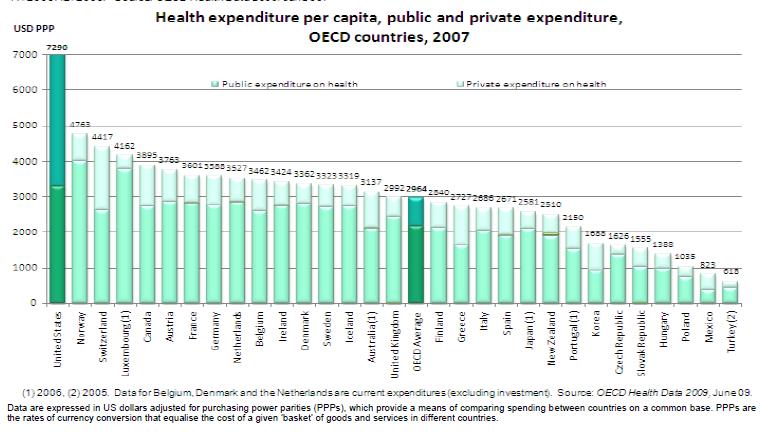
- On a per capita basis also the U.S. spent the highest with a total of $7,290 which is two-and-half times the OECD average
- The public share of health care expenditure in the USA (45%) is less than any other OECD country
- Despite spending the most, the U.S. provides health care coverage for only the elderly, disabled and some of the poor people
- In comparison, the same amount is enough to provide universal health care insurance by the government for all citizens in other OECD countries
- 35% of total health care expenditures is done by private health insurance which is the highest In OCED
- Despite the high medical expenditure,there are fewer doctors per capita in the U.S. than most other OECD countries
- Life expectancy in the U.S. is lower when compared with Japan,Switzerland, Canada and Australia
- Infant morality rates in the U.S. is higher than most OECD countries. In 2006, it was 6.7 per live births relative to OECD average of 4.7
- The proportion of daily smokers has fallen the most (> 50%) between 1980 and 2007 in the U.S. due to public awareness and high taxation
- Obesity rate among adults is the highest in the U.S. in the OECD countries at 34.3% in 2006. Higher obesity rates leads to higher health care spending in the future
Charts:
Click to Enlarge
The above data lead me to do some research on the health care system. In 2007, we spent an astonishing $2.2 Trillion on health care expenses. The government social programs Medicare and Medicaid spending grew by 7.2% and 6.4% in 2007. On a long-term basis I observed that the price food has fallen continuously over the years but the cost of health care has gone up in the opposite direction.
One benefit of spending so much on health care is that it provides stable and well-paid employment opportunities for many people in that sector. In fact, it is one of the safest sector to be employed in now.
One reason for the fewer number of doctors per capita in the U.S. is the total number of medical schools in the U.S. is low.There are only 131 accredited M.D.-granting medical schools in the country. The total number of graduates coming out of these schools per year seem to be low as well. For example, last year just 16,167 students graduated to be physicians.
In his speech to the American Medical Association last month, even our President Obama highlighted the problems in the health care system. Some of the points mentioned by him match with the OECD’s findings as noted above. President Obama said:
“Today, we are spending over $2 trillion a year on health care — almost 50 percent more per person than the next most costly nation. And yet, as I think many of you are aware, for all of this spending, more of our citizens are uninsured, the quality of our care is often lower, and we aren’t any healthier. In fact, citizens in some countries that spend substantially less than we do are actually living longer than we do.
Make no mistake: The cost of our health care is a threat to our economy. It’s an escalating burden on our families and businesses. It’s a ticking time bomb for the federal budget. And it is unsustainable for the United States of America. ”
The current administration is planning to dramatically change the health care system in this country. The official site of the U.S. government healthreform.gov states:
“The President’s 2010 Budget lays the groundwork for reform of the American health care system, most notably by setting aside a deficit-neutral reserve fund of $635 billion over 10 years to help finance reform of our health care system to bring down costs, expand coverage, and improve quality.”
It remains to be seen if the reforms proposed will lead to reduced costs and improved efficiency in the system. A few other interesting stats from the site include:
- Employer-sponsored health insurance premiums have nearly doubled since 2000, a rate three times faster than wages.
- In 2008, the average premium for a family plan purchased through an employer was $12,680, nearly the annual earnings of a full-time minimum wage job.
- Americans pay more than ever for health insurance, but get less coverage.
Some of the other causes of issues for the inefficient health care system are: malpractice suits, bureaucracy, monopoly pricing power of drug companies, lack of transparency of prices for various items such as medical procedures, surgeries, etc. preventing comparison shopping by patients, greedy doctors, paperwork hell, defensive treatments performed by doctors, inadequate medical facilities, growing number of retiring baby-boomers, increasing population, seeking medical care for unnecessary situations,etc. What are your thoughts on this issue?. Please feel free to share it in the comments section.


